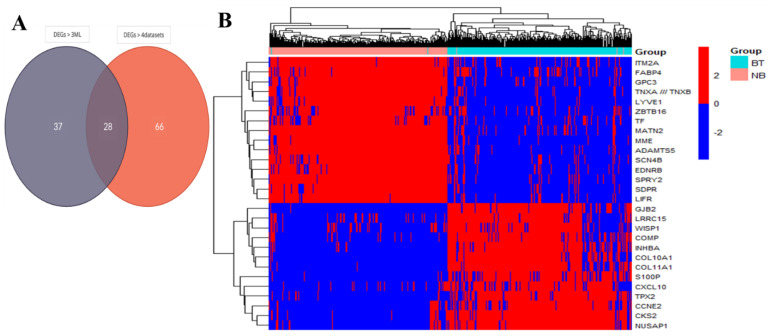
Figure 4.
(A) Venn diagram showing 28 hub genes derived from the intersection of DEGs > 3 ML and DEGs > 4 datasets. (B) Unsupervised hierarchical clustering: heatmap of 701 samples, including 356 breast tumor (BT, cyan) and 345 normal breast (NB, pink) tissues, showing the gene expression pattern of 28 hub genes, including diagnostic and prognostic gene signatures. Upregulated genes are shown in red and downregulated genes are in blue.

