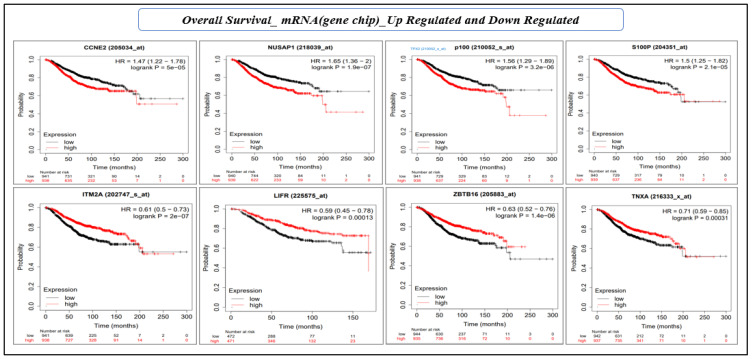
Figure 8.
KM plot based on the overall survival analysis of eight individual genes (mRNA, gene-chip) of prognostic gene signature. The X-axis and Y-axis represent time in months and the probability of the survival of patients, respectively. The impact of the high and low expression of the gene on patient survival is shown in red and black lines, respectively.

