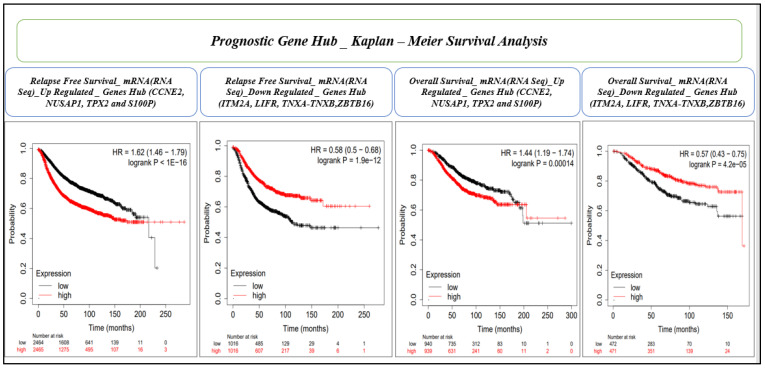
Figure 9.
RFS and OS analyses and the validation of upregulated (CCNE2, NUSAP1, TPX2, and S100P), and downregulated (ITM2A, LIFR, TNXA, and ZBTB16) gene groups (mRNA, RNA seq) of the prognostic gene signature. The X-axis and Y-axis represent time in months and the probability of the survival of patients. The impact of the high and low expression of the gene on patient survival is shown in red and black lines, respectively.

