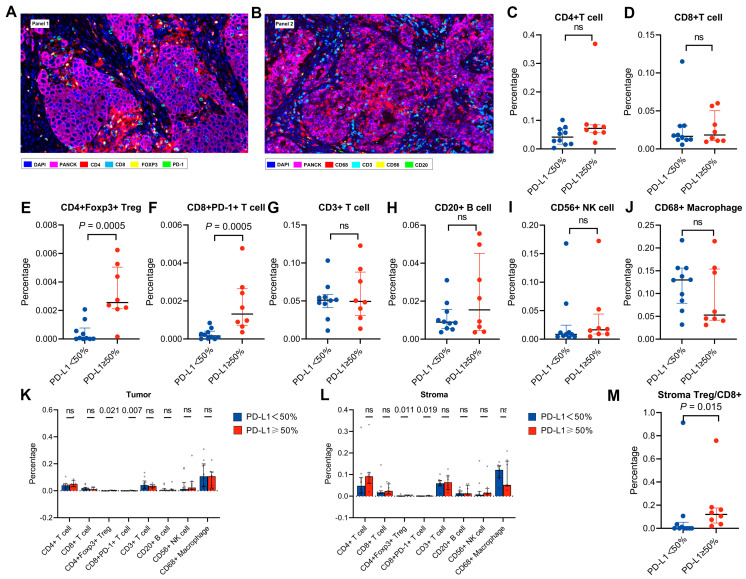
Figure 3.
Features of the tumour microenvironment. (A,B) Representative multiplex immunofluorescence images of ALK−rearranged NSCLC tumour sections analysed for Panel 1 (A) and Panel 2 (B) markers. (C–J) Differences in the distribution of CD4+ T cells (C), CD8+ T cells (D), Tregs (E), exhausted CD8+ T cells (F), CD3+ T cells (G), B cells (H), NK cells (I) and macrophages (J) between PD−L1hi and PD−L1lo patients. (K,L) The distribution of the indicated immune cell infiltration in the stroma (K) and tumour region (L) between PD−L1hi and PD−L1lo patients. (M) Treg/CD8 ratio in PD−L1hi and PD−L1lo patients. ns, not significant (Mann-Whitney U test).

