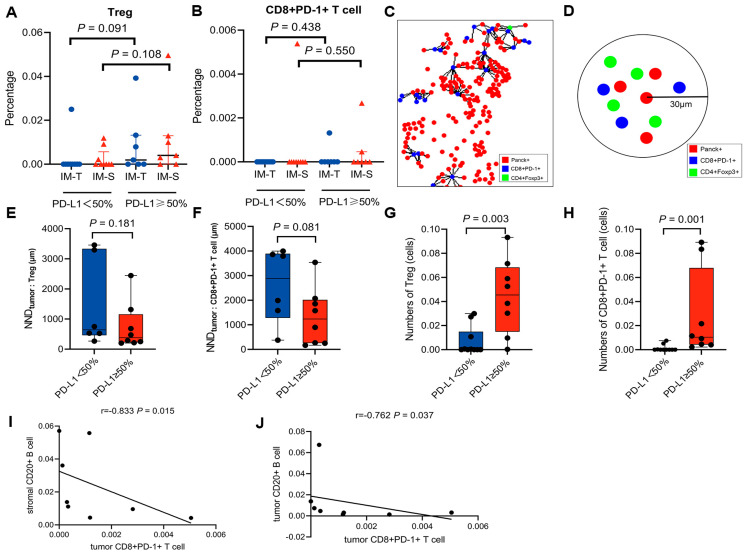
Figure 4.
Location, spatial distribution and correlation analysis of Treg and exhausted CD8+ T cells. (A,B) Treg (A) and exhausted CD8+ T cell (B) percentages in the tumour and stroma of the invasive margin (IM) region. (C) Representative image showing the NND analysis, with the NND calculated from tumour cells to their nearest Treg and exhausted CD8+ T cells. (D) Cartoons depicting the number of cells within a 30 μm radius (tumour cells (red), Tregs (green), and exhausted CD8+ T cells (blue)). (E,F) Boxplots of the average NND between Tregs (E), exhausted CD8+ T cells (F) and tumour cells. (G,H) Boxplots showing the number of Tregs (G) and exhausted CD8+ T cells (H) within a 30 μm radius of tumour cells. (I,J) The correlation between exhausted CD8+ T cells and B cells in PD−L1hi patients.

