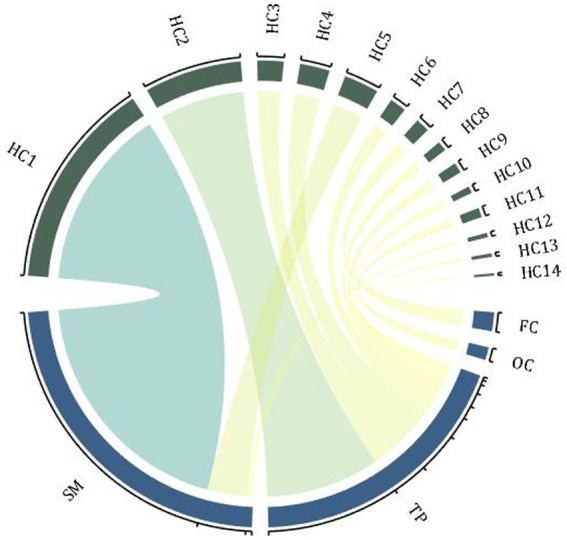
Figure 1.

Hot clusters and associated genes. The enrichment distribution of 16 hot clusters in 4 brain regions, and the width of the arcs indicates the weight of the cluster size. FC, frontal cortex; TP, temporal and parietal regions; SM, sensory-motor regions; OC, occipital regions; HC, hot clusters (associated genes: HC1-CACNA1A, ERBB4; HC2-PPP1R1B; HC3-ATP2B2; HC4-PPP3CA, NRG3; HC5-ZBTB20, RELN; HC6-OPCML; HC7-INPP4B; HC8-ZNF365; HC9-ANK3; HC10-ZBTB20; HC11-PSAP; HC12-BMP6, EIF2B5; HC13-NRG3, PRKCA; HC14-FGF1).
