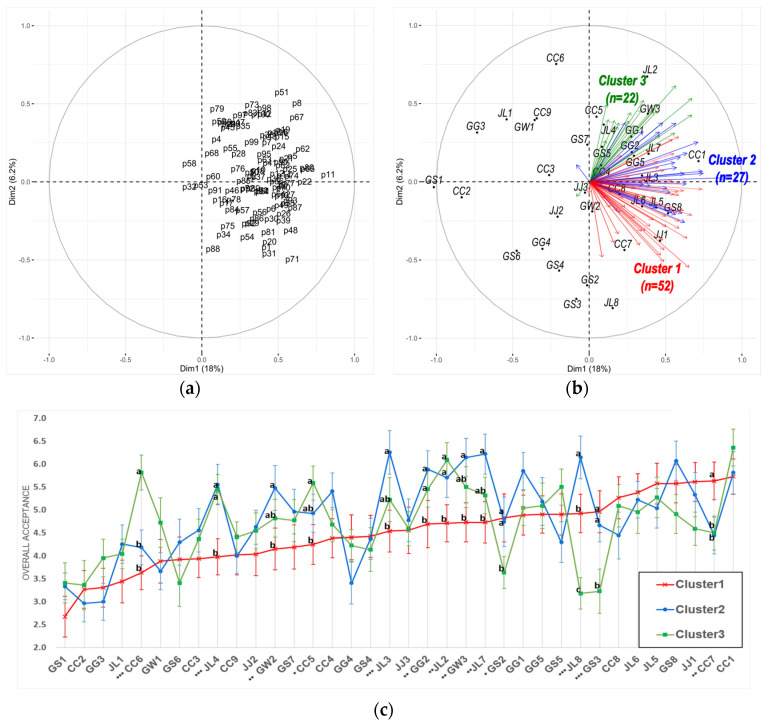
Figure 2.
Internal preference map obtained from a PCA of consumers’ liking scores: (a) first two PC of consumers’ liking scores, (b) PCA biplot of individual liking scores colored according to the cluster corresponding to the samples, and (c) differences in averaged overall acceptance scores among the three consumer clusters. *, ** and *** represent a significant difference among the samples at p < 0.05, 0.01 and 0.001, respectively; different superscripts represent significant differences by Fisher’s LSD at p < 0.05.

