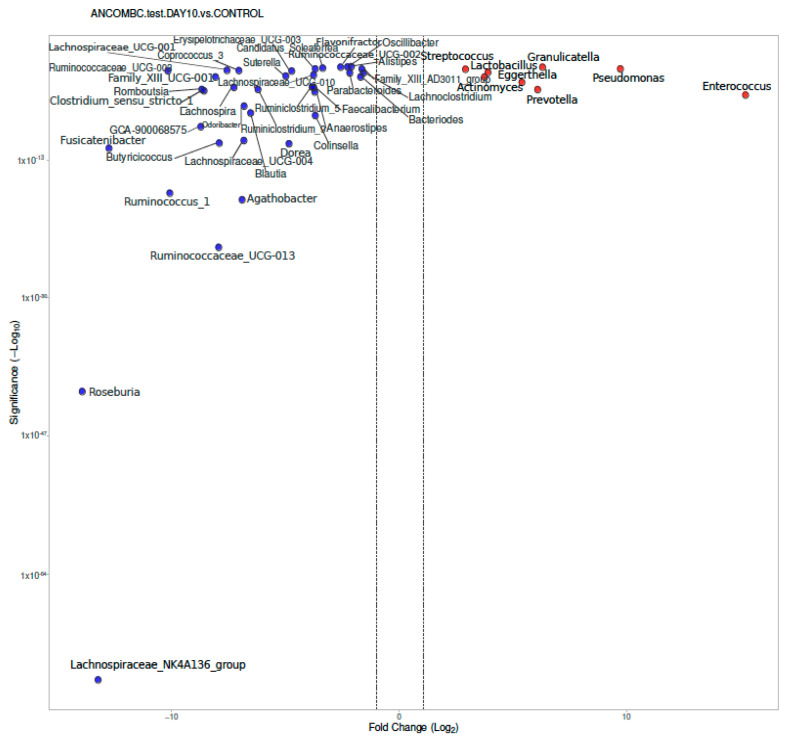
Figure 4.
Differential abundance of genera from stool samples, calculated using ANCOM-BC, between children with IMD at Day 10 and healthy controls, with volcano plot. Significant genera are plotted according to their log2 fold change and adjusted p-values. Red dots: IMD at Day 0; blue dots: healthy children.

