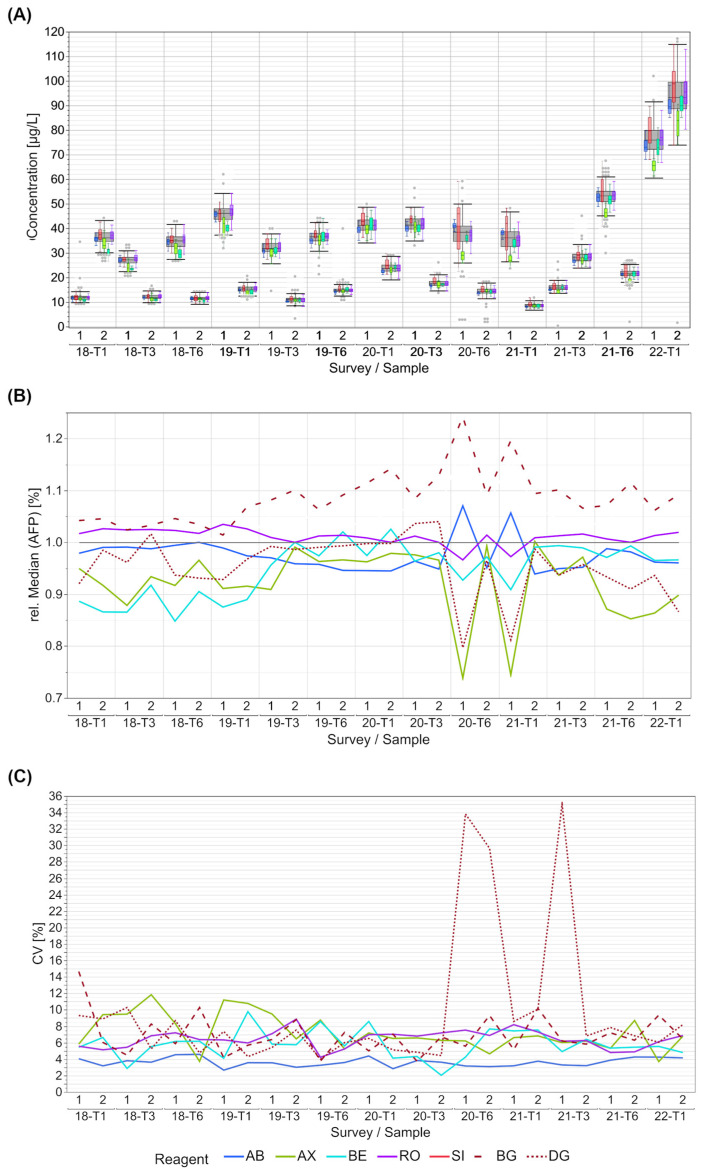
Figure 2.
Manufacturer-dependent analysis of EQA results for AFP levels for all results (A), a comparison of manufacturer-dependent median differences in comparison to the overall median (B), and evaluation of manufacturer-dependent CVs (C), shown from 2018 to the beginning of 2022. Data of two samples per survey are shown. The grey boxes display all results for the respective sample, and the distributions of specific manufacturer-based collectives are illustrated as smaller, colored box plots in overlay with the total results (blue: AB, green: AX, cyan: BE, violet: RO, bright red: SI (only present in (A)), dark red: BG, dark red dotted: DG). Grey dots mark the outliers of all results. Outliers were excluded from colored boxes. For all boxes, the whiskers stretch from the 1st quartile − 1.5 * (interquartile range) to the 3rd quartile + 1.5 * (interquartile range). Due to the multimodality of the SI collective, the relative median and the CVs were calculated for the two larger SI sub-collectives BG and DG.

