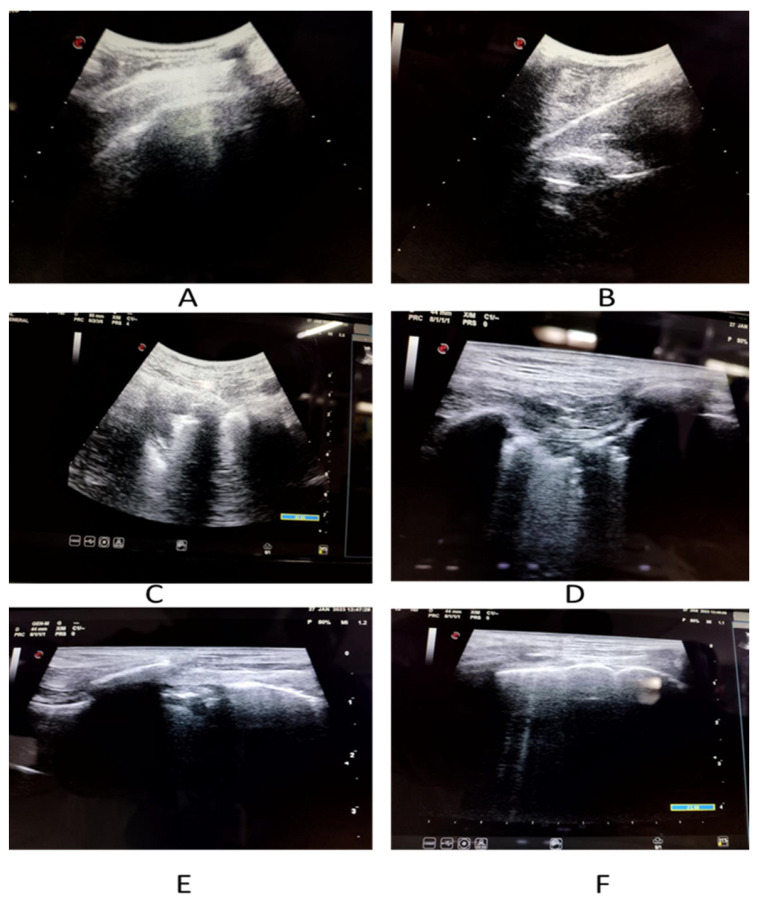
Figure 2.
Imaging spectrum of COVID-19 patients on LUS. (A) Shows thickened pleura with small pleural effusion. (B) Depicts thickened irregular pleural line. (C) Demonstrates confluent B-lines. (D) Reveals isolated as well as confluent B-lines. (E) Displays thickened irregular pleural line with confluent B-lines. (F) Denotes isolated B-lines.

