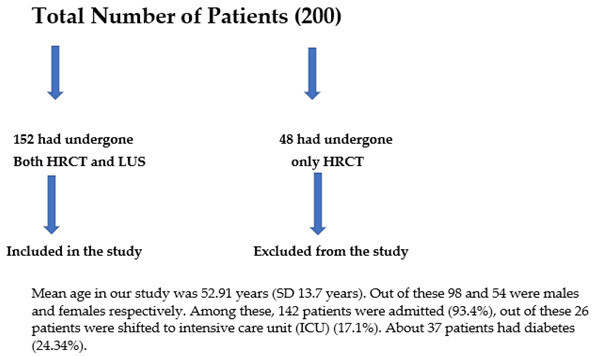
Table 1.
Distribution of demographic and baseline characteristics of study.

| ||
|---|---|---|
| Demographic and Baseline Characteristics | ||
| Age (years) | Frequency | Percentage |
| <=20 years | 01 | 0.66% |
| 21–40 years | 26 | 17.11% |
| 41–60 years | 86 | 56.58% |
| 61–80 years | 37 | 24.34% |
| >80 years | 02 | 01.32% |
| Mean ± SD | 52.9 ± 13.7 | |
| Median (25th–75th percentile) | 50 (45–61.25) | |
| Range | 18–88 | |
| Gender | ||
| Female | 54 | 35.53% |
| Male | 98 | 64.47% |
| Diabetics | 37 | 24.34% |
