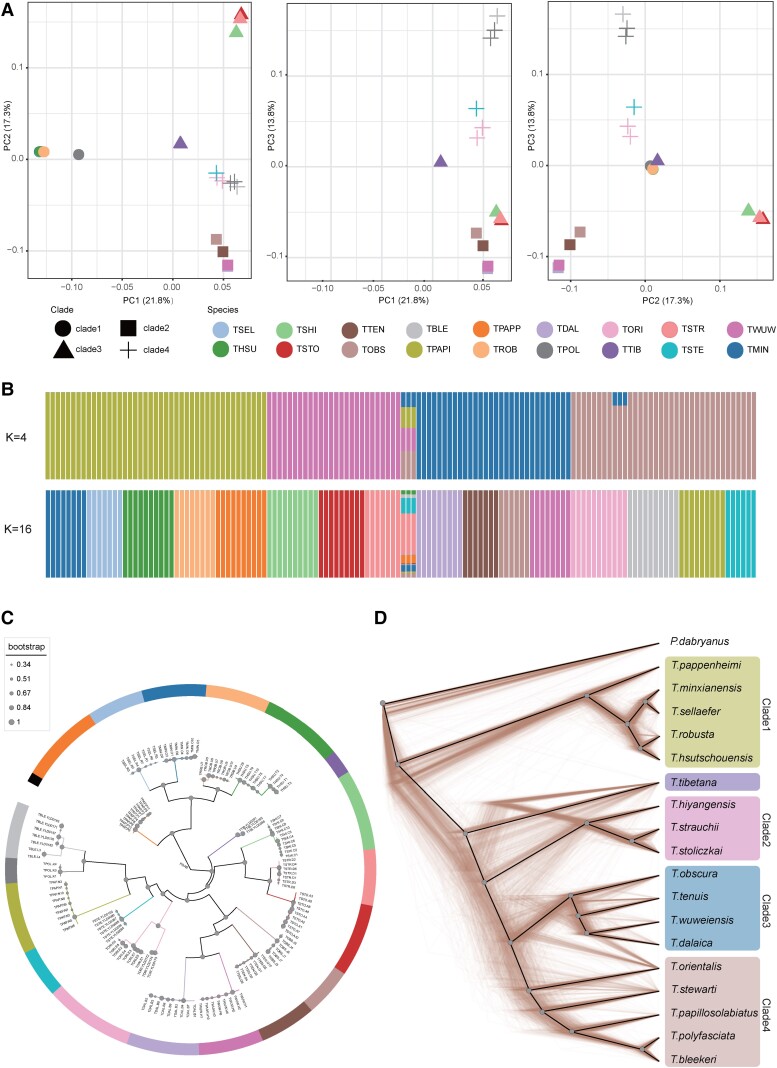
Fig. 1.
Population structure and inferred phylogenetic relationships among Triplophysa species. (A) PCA of 138 Triplophysa individuals. (B) Population structure by STRUCTURE analysis assign individuals to five clusters with K = 4, and the optimal K = 16, which can assign most individuals to well-defined species. Each colored bar represents one individual, and colored segments represent proportions of genetic components. (C) The coalescent-based species tree. The node size represents ASTRAL LPP according to the scale shown on the left. The color of the branches refers to the species as in A and B (color scheme as in B, K = 16, except T. tibetana and T. polyfasciata). (D) Cladograms of the prevalent discordances trees among 1,000 randomly selected local trees derived from 200-kb windows, and solid black line represents the consensus tree calculated by DensiTree, which is consistent with Astral species tree (color scheme as in B, K = 4).

