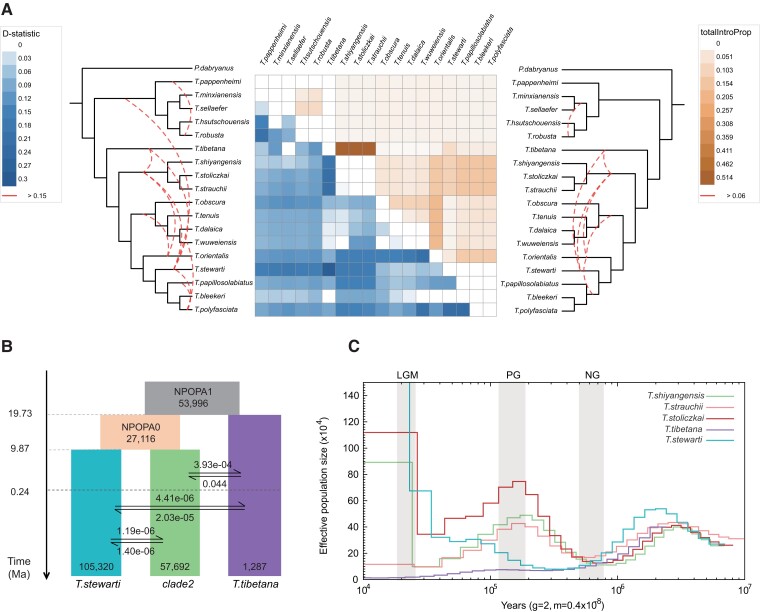
Fig. 2.
Introgression between Triplophysa species. (A) Heat map of average pairwise D values per species pair (in left) and the average totalIntroProp per species pair inferred through the QuIBL analysis (in right). Empty squares represent zero or nonsignificant values. The species tree is shown on both sides. Red dotted lines on the species tree of two sides indicate interspecific introgression events based on summarized results with threshold of D > 0.15 and totalIntroProp > 0.06, respectively. (B) Schematic of demographic history of the three Triplophysa species simulated by fastsimcoal2. Rectangles represent each species population and their ancestral lineages. The numbers on the bottom of rectangle represent Ne, and arrows indicate the per-generation migration rate (m) between species populations. The time node of each historical scenario is marked on the left timeline. (C) Demographic history inferred by the PSMC model. Lines represent the median estimated Ne of five Triplophysa species. The periods of the LGM, PG, and NG are highlighted with gray vertical bars.

