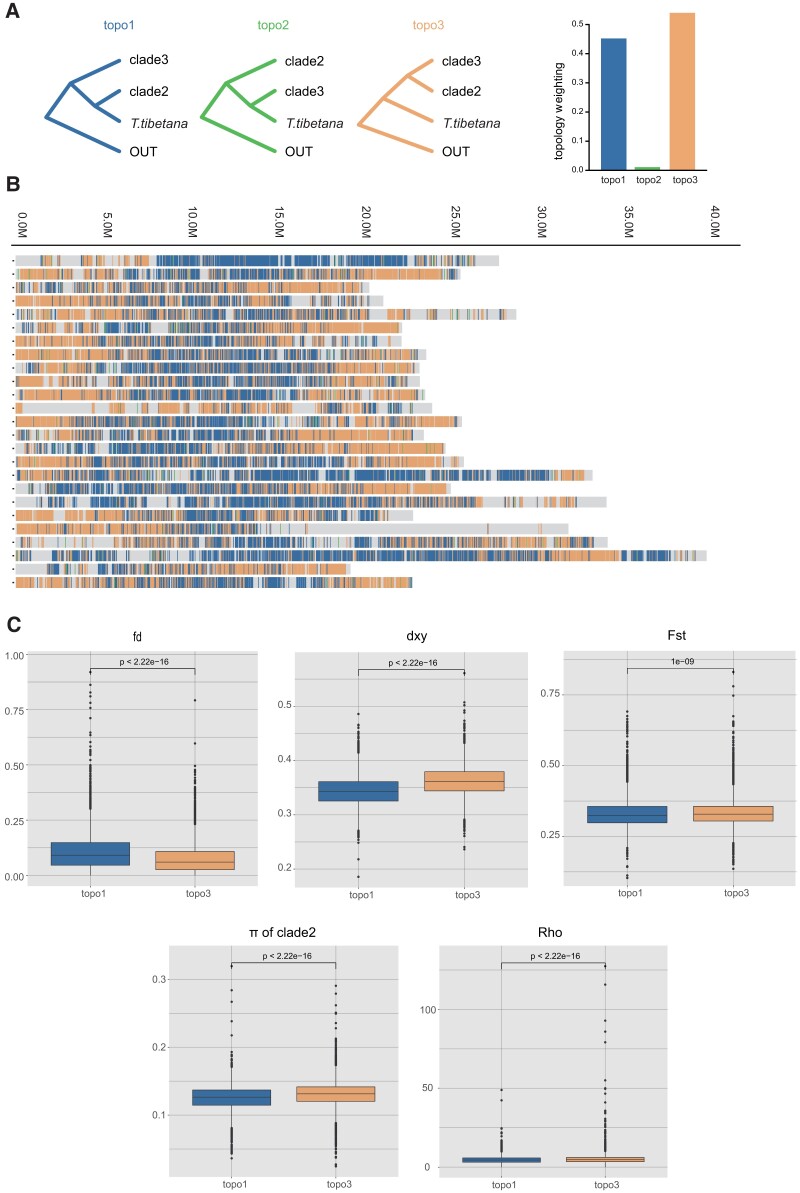
Fig. 3.
Window-based population genomic analysis. (A) Three possible phylogenetic topologies inferred from 25-kb window local ML trees for T. tibetana clade2 and clade3, with P. dabryanus as outgroup species. The colored vertical bars represent the windows with complete monophyly of the three alternative topologies, where the proportion of the three topologies is the average value of three cade2 species. (B) Distribution of tree topologies across the genome. Colors are consistent with the topology in A. (C) Population genomic parameters of two different topological regions between T. tibetana and clade2.

