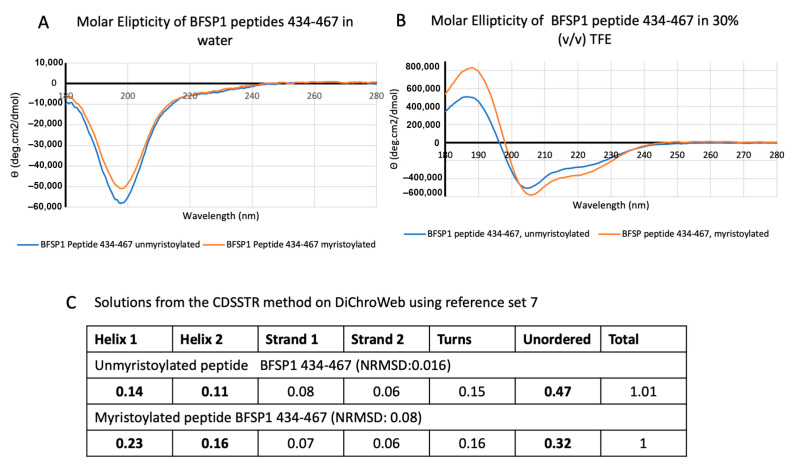
Figure 2.
CD spectrum for myristoylated and unmyristoylated peptides spanning residues 434–467 in BFSP1. The CD spectra for chemically synthesized peptides spanning the residues 434–467 of human BFSP1 ± a myristoyl group were measured in water (A) and in (B) 30% (v/v) TFE. Peptides (0.05 mg/mL) were measured in a Jasco Quartz cell (0556) with a 0.1cm pathlength. Spectra shown are buffer blanked. Note the shift in the minima (206/220 nm) for the myristoylated peptide, which is reflected in the increased α-helical content as indicated from the CDSSTR outputs (C).

