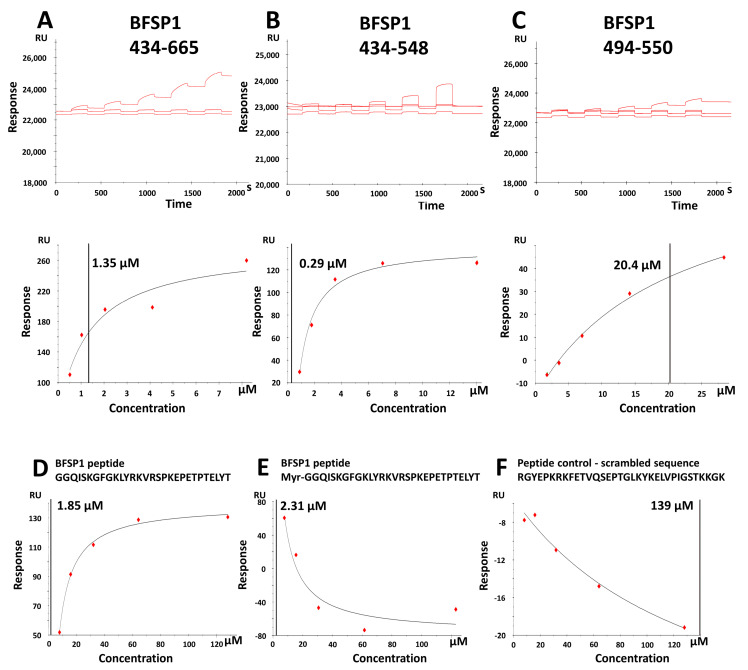
Figure 4.
SPR measurement of the KD for BFSP1 C-terminal domain sequences. The sensorgram and calculated affinity (Equilibrium dissociation constant; KD) of the BFSP1 fragments 434–548 (A), 434–548 (B) and 494–550 (C) for L1 biosensor chip loaded with bovine lens membrane lipids over a five-point concentration range. The plots of RU against concentration for BFSP1 434–665 (A), 434–548 (B) and 494–550 (C). The fragments were produced recombinantly in E.coli, and the final protein preparations after SEC purification used for the SPR experiments are shown in the insets of each panel. The chemically synthesized peptides of BFSP1 434–467 ± myristate (D,E) were compared to a scrambled peptide control (F). In all the plots (A–F), the KD value is included in the plot and can be cross-referenced to Table 1 and Table 2.

