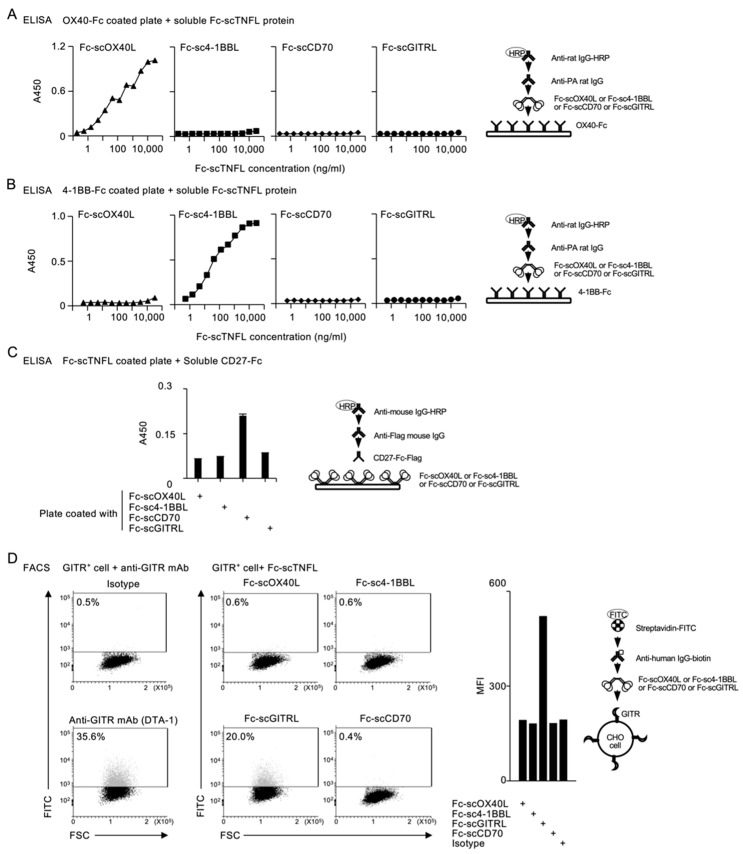
Figure 3.
Binding specificity of Fc−scTNFL proteins to their corresponding receptors. (A–C) Validation of specific interactions between Fc−scOX40L and OX40−Fc (A), Fc−sc4-1BBL and 4-1BB−Fc (B) and Fc−scCD70 and CD27−Fc (C), evaluated by ELISA (average and standard deviation of triplicate wells in (C)). (D) Validation of specific interaction between Fc−scGITRL and cell surface GITR, evaluated by flow cytometry (middle) and expressed as mean fluorescent intensity (MFI) (right). GITR expression on CHO cells was confirmed by staining with anti-GITR antibody (DTA-1) (left). Numbers adjacent to outline areas indicate percent GITR+ cells. Data are from one experiment representative of at least two independent experiments with similar results.

