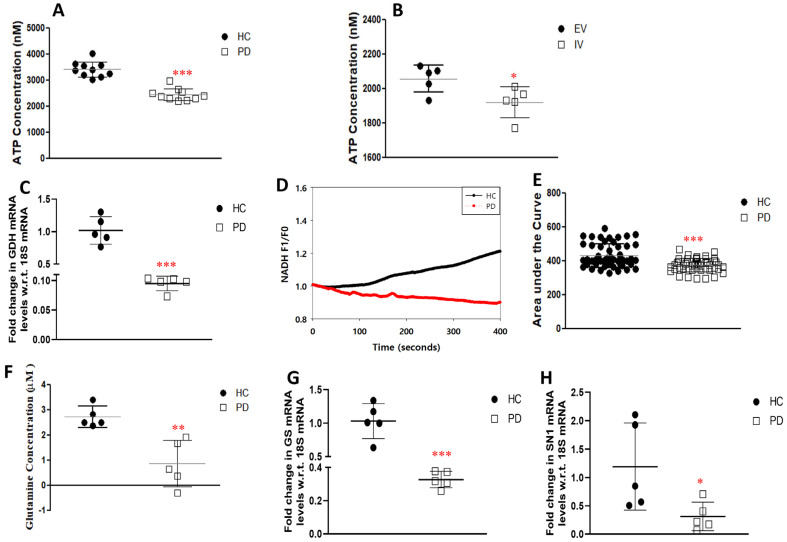
Figure 7.
Glutamate metabolism and expression of genes associated with it and its transport. (A) Functional ATP production luminescence in HC and PD astrocytes. (B) Functional ATP production luminescence in EV and IV transfected U87 cells. (C) qPCR analysis of mRNA levels of glutamate dehydrogenase (GDH). (D) Activity of GDH enzyme in HC and PD astrocytes. (E) Cumulative F1/F0 is represented as the area under the curve for HC and PD astrocytes. (F) Glutamine content in HC and PD astrocytes. (G,H) qPCR analysis of mRNA levels of (G) glutamine synthase (GS) and (H) system N1 Na+ and H+—coupled glutamine transporter (SN1). n = 5; mean ± SD; w.r.t, with respect to; *—p < 0.05 (EV versus IV or HC versus PD); **—p < 0.01 (HC versus PD); ***—p < 0.001 (HC versus PD).

