Figure 4.
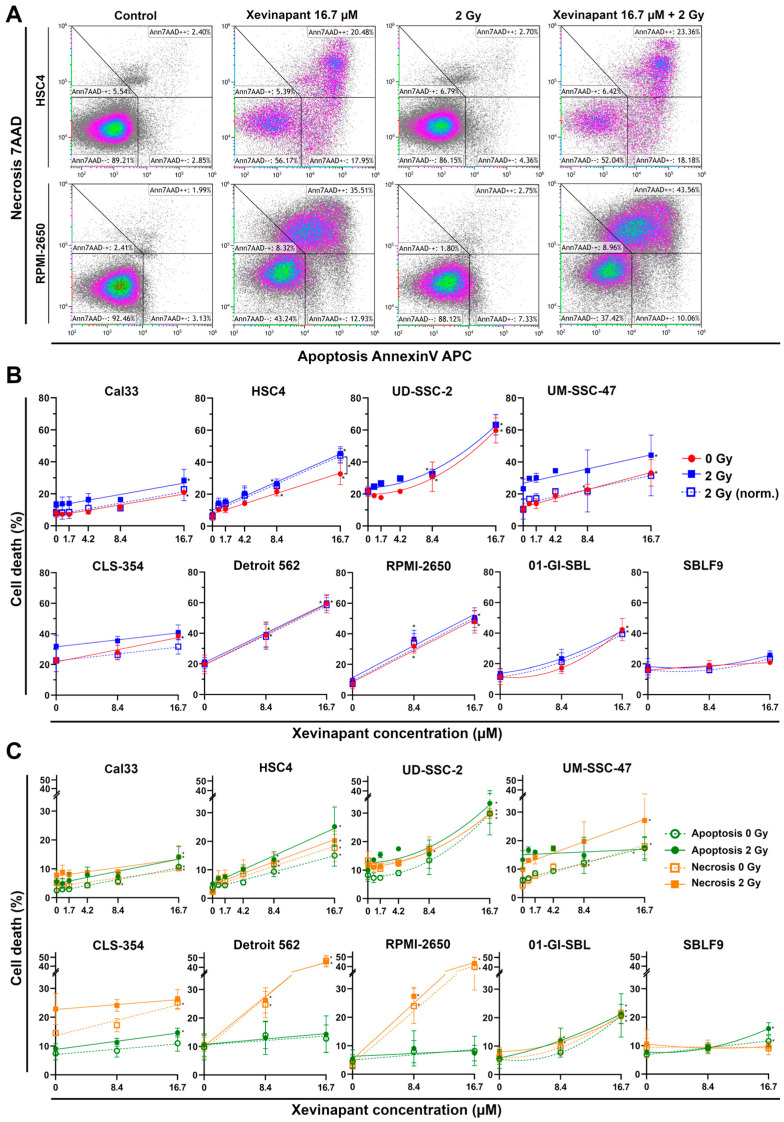
Flow cytometric cell death analysis after monotherapy with Xevinapant or in combination with 2 Gy IR: (A) Exemplary gating strategy of AnnexinV/7AAD staining. Ann7AAD − − cells defined as “alive”, Ann7AAD + + as “necrotic” and Ann7AAD + − as “apoptotic”. Plots of HSC4 and RPMI-2650 cells untreated (control), treated with either Xevinapant (16.7 µM) or IR (2 Gy) alone and in combination. (B) All cells were treated with 8.4 µM and 16.7 µM Xevinapant alone (red) and in combination with 2 Gy IR (blue). A total of 4 cell lines were additionally treated with lower concentrations of Xevinapant (0.8; 1.7; 4.2 µM). Graphs were fitted using linear regression analysis. Dashed line represents cell death at 2 Gy, normalized to the unirradiated group. (C) Cell death separated into apoptosis (green) and necrosis (orange). Xevinapant doses are equal to (B). Dashed line represents cells treated with Xevinapant alone, and straight line represents cells treated with Xevinapant and IR (2 Gy) in combination. Each value represents mean ± SD (8.4, 16.7 µM, n = 3; 0.8, 1.7, 4.2 µM, n = 2). Significance of cell death between Xevinapant-treated cells and the untreated control and between Xevinapant-treated cells with IR and IR alone was determined by Mann–Whitney U test * p ≤ 0.05. * without parenthesis means that the values were compared with those of the same group (0 Gy or 2 Gy) at 0 µM.

