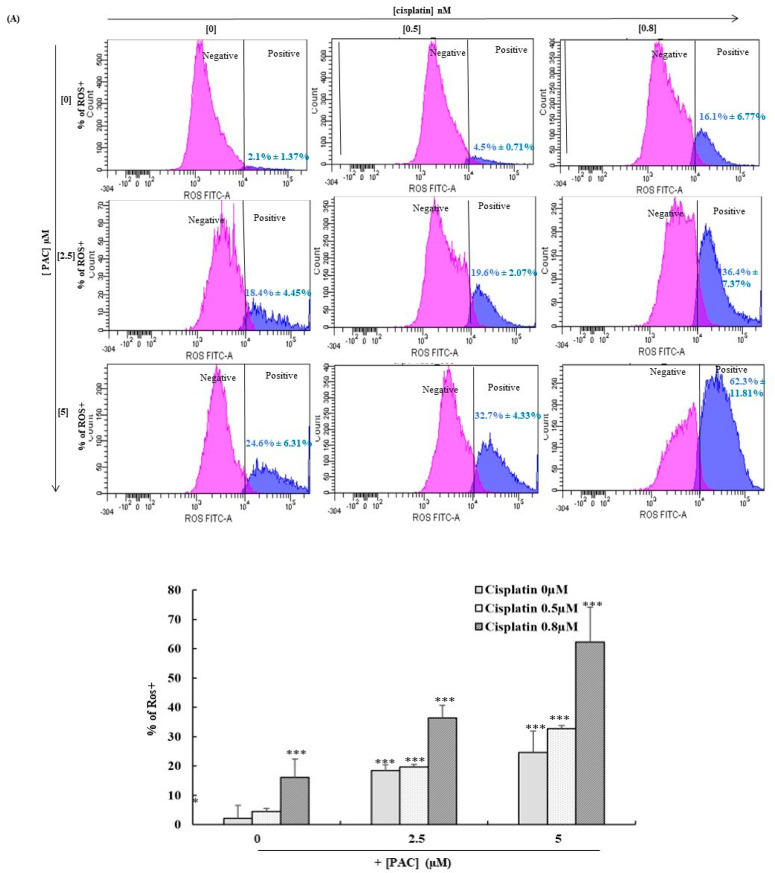
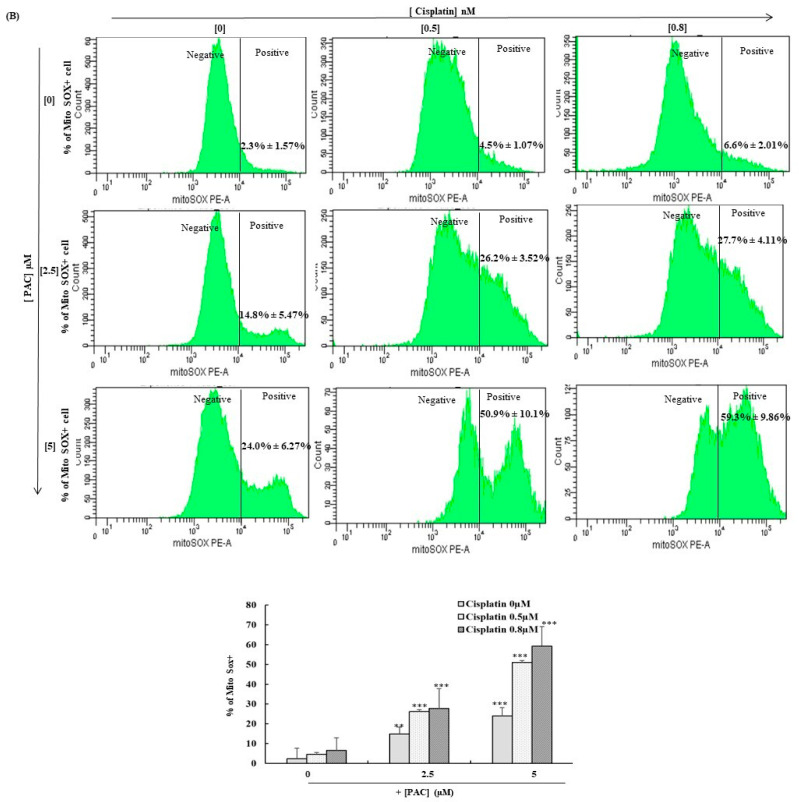
Figure 6.
PAC promotes the effect of cisplatin on the inhibition of oxidative stress in oral cancer cells. (A) The quantification of ROS in flow cytometry (n = 4) showed inhibition when the Ca9-22 cells were treated with PAC and cisplatin for 24 h. The pink peak represents the % of ROS+ cells, and the blue peak is the percentage of ROS− cells. (B) MitoSox expression performed by flow cytometry (n = 4). ** p < 0.005 *** p < 0.0005 compared to untreated cells.


