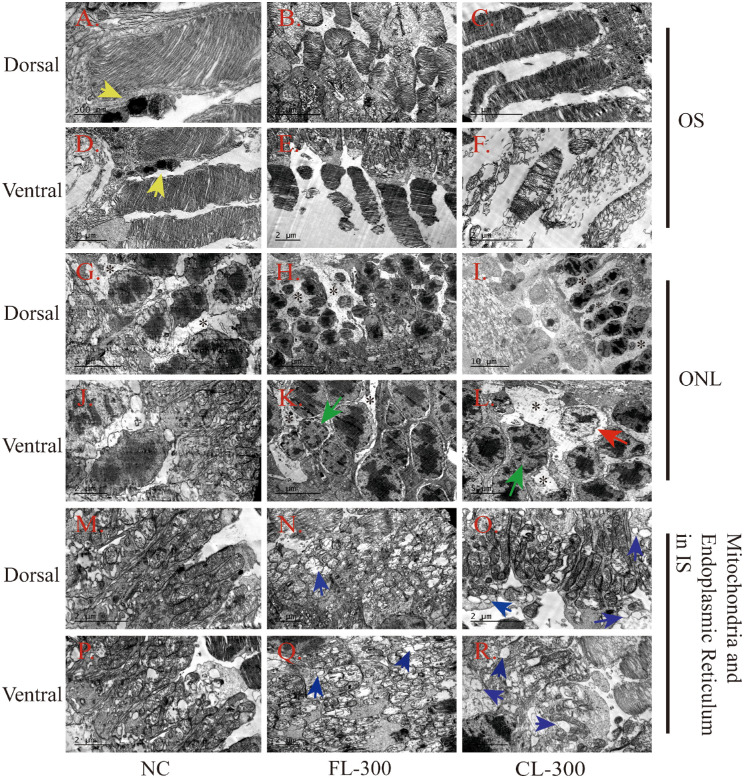
Figure 3.
Representative TEM images of the retina in albino guinea pigs after 28 days of exposure at 300 lux. (A, D) The OS from the dorsal and ventral regions, respectively, in the NC group. Scale bars: 500 nm and 1 µm, respectively. (B, E) The OS from the dorsal and ventral regions, respectively, in the FL-300 group. Scale bars: 5 µm and 2 µm, respectively. (C, F) The OS from the dorsal and ventral regions, respectively, in the CL-300 group. Scale bars: 2 µm. (G, J) The ONL from the dorsal and ventral regions, respectively, in the NC group. Scale bars: 5 µm and 2 µm, respectively. (H, K) The ONL from the dorsal and ventral regions, respectively, in the FL-300 group. Scale bars: 10 µm and 5 µm, respectively. (I, L) The ONL from the dorsal and ventral regions, respectively, in the CL-300 group. Scale bars: 10 µm and 5 µm, respectively. (M, P) The mitochondria and ER from the dorsal and ventral regions, respectively, in the NC group. Scale bars: 2 µm. (N, Q) The mitochondria and ER from the dorsal and ventral regions, respectively, in the FL-300 group. Scale bars: 2 µm. (O, R) The mitochondria and ER from the dorsal and ventral regions, respectively, in the CL-300 group. Scale bars: 2 µm. Yellow arrows identify the lysosomes; green arrows identify the edge aggregation of chromatin; the red arrow identifies the appearance of a widening of the perinuclear space; blue arrows identify the expanded ERs; and black asterisks identify the Müller cell processes.

