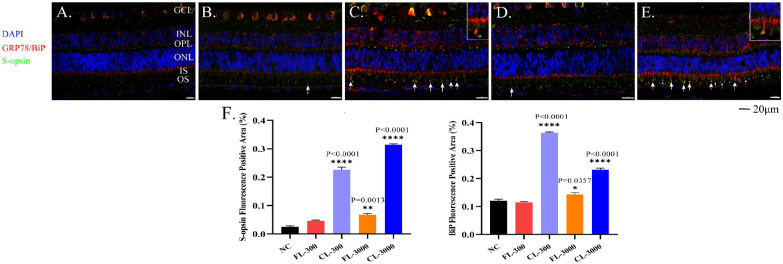
Figure 5.
Immunofluorescence of retinas showed the expression levels of S-opsin and GRP78/Bip. (A) NC group; (B) FL-300 group; (C) CL-300 group; (D) FL-3000 group; (E) CL-3000 group. Retinas were stained with antibodies against S-opsin (green) and M-opsin (red). Nuclei were stained with DAPI (blue). In the experimental groups, GRP78/Bip and S-opsin aggregation is indicated by white arrows with magnified details in C and E. (F) Expression levels in S-opsin and GRP78/Bip quantified by Aipathwell show positive fluorescence areas in the retinas. The values shown are mean ± SD analyzed with one-way ANOVA (n > 3). *P < 0.05, **P < 0.01 and ****P < 0.0001 versus the NC group. Scale bar: 20 µm.

