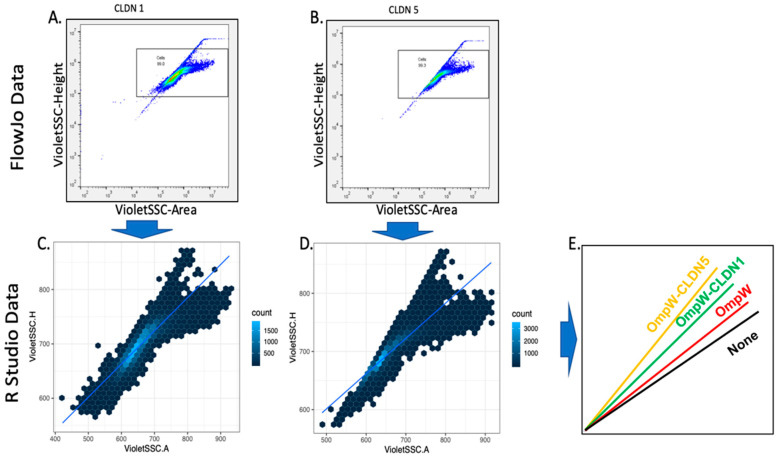
Figure 3.
Data analysis using FlowJo and R Studio software. Flow cytometry data were gated in FlowJo software (panels A,B), and R Studio converted the data into Hexbin graphs (panels C,D). Experimental Slopes are determined and compared (panel E); cells alone and expressing OmpW only display low slopes while CLDN expressing cells have larger slopes. (Panel E) graphically demonstrates the results that can be obtained from this analysis.

