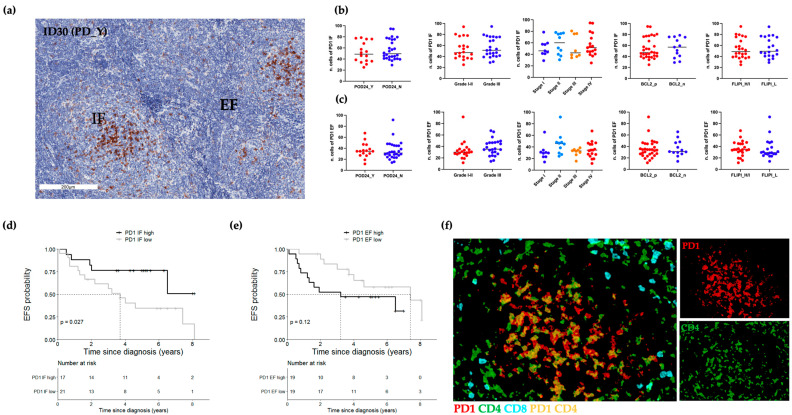
Figure 6.
In situ PD1 expression in IF and EF regions. (a) Representative bright-field IHC image of PD1 in the IF and EF areas of a DR_Y case (#ID30). (b) Box plots of IF IHC scores, each dot represents the median value of 10 ROIs for each patient. (c) Box plots of EF IHC scores, each dot represents the median value of 10 ROIs for each patient. (d) High IF PD1 values (≥53.75/HPF; n = 17) showed a better EFS than those with lower values (n = 21). (e) Kaplan–Meier curves comparing EFS between PD1 EF high (≥34/HPF; n = 19) and PD1 EF low (n = 19). (f) Representative pseudo-fluorescence image of three-color staining: PD1 (red), CD4 (green) and CD8 (cyan) (#ID30). PD1+ cells were mainly IF CD4+ T cells (yellow). POD24, progression of disease within 24 months; EFS, event-free survival; PD, progressive/recurrent disease; FLIPI, Follicular Lymphoma international prognostic index; H/I, High/Intermediate; L, Low. Scale bars, 200 μm.

