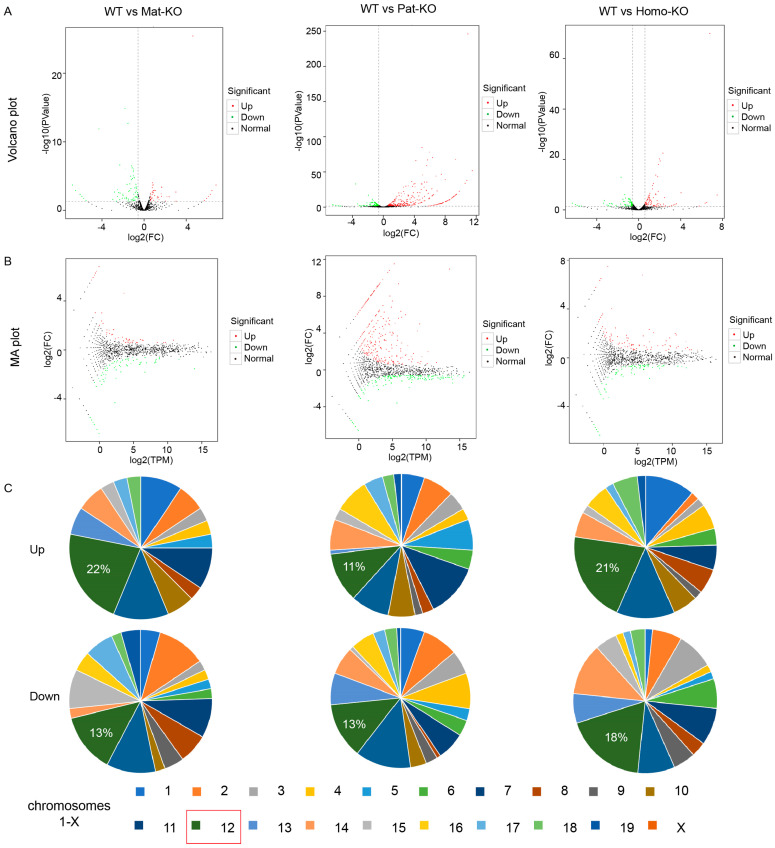
Figure 3.
Detection of miRNA DEGs in WT and Meg8-DMR knockout mice. (A) Volcano plot corresponding to the WT, Pat-KO, Mat-KO, and Homo-KO. From left to right: WT vs. Pat-KO, WT vs. Mat-KO, and WT vs. Homo-KO. (B) Meandiff plot for the WT compared with Pat-KO, Mat-KO, and Homo-KO. (C) Distribution of upregulated and downregulated miRNAs in Pat-KO, Mat-KO, and Homo-KO on chromosomes.

