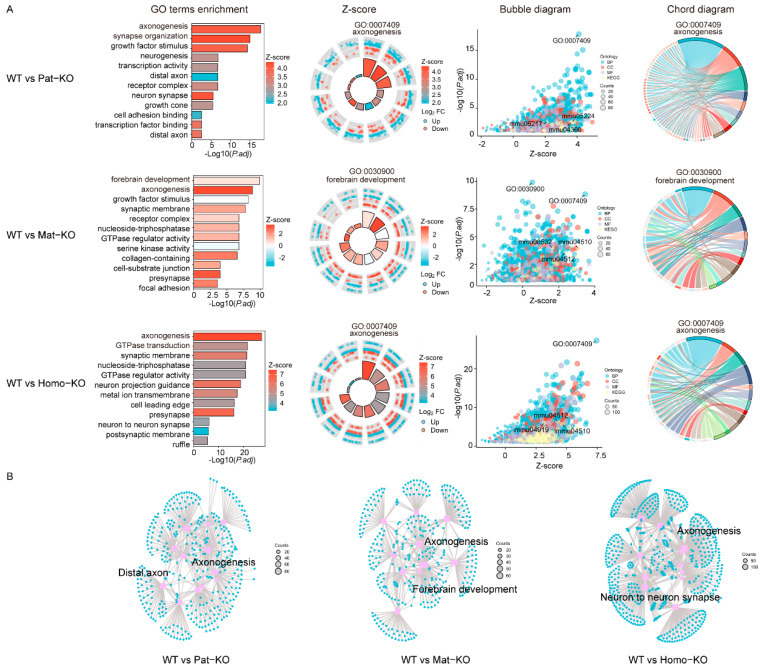
Figure 4.
Go and KEGG pathway enrichment of DEGs. (A) GO terms and KEGG pathway enrichment results. From left to right: the top 12 GO enrichment results and Z-score results; bubble diagram and relationships between DEGs and the KEGG pathway. (B) Network diagram and relationships between DEGs and the top 12 GO enrichment results.

