
FIGURE 1.
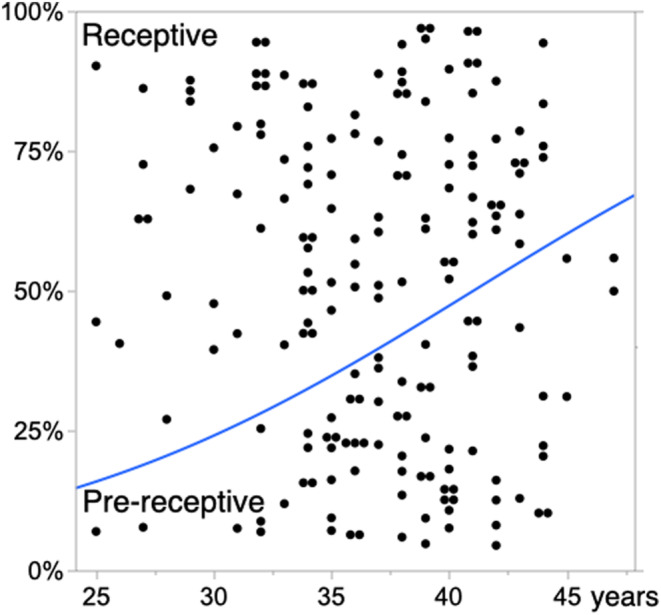
Age‐related increase in pre‐receptive endometrium and decrease in receptive endometrium, interpreted using endometrial receptivity analysis (ERA). The horizontal axis represents patient age, and the vertical axis represents the proportion of endometrial receptivity interpreted using ERA. p = 0.0018 in logistic regression analysis with the Wald test.