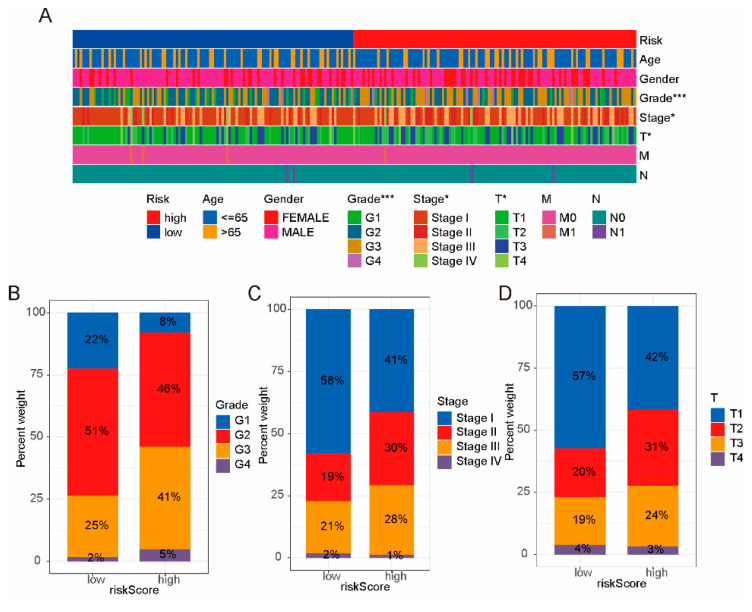
Figure 4.
The correlation between risk model and clinical characteristics. (A) Heatmap of risk model and clinical characteristics. The risk model was associated with grade, stage, and T stage. (B–D) The high-risk group had higher grade, stage, and T stage of HCC. * pvalue < 0.05, *** pvalue < 0.001.

