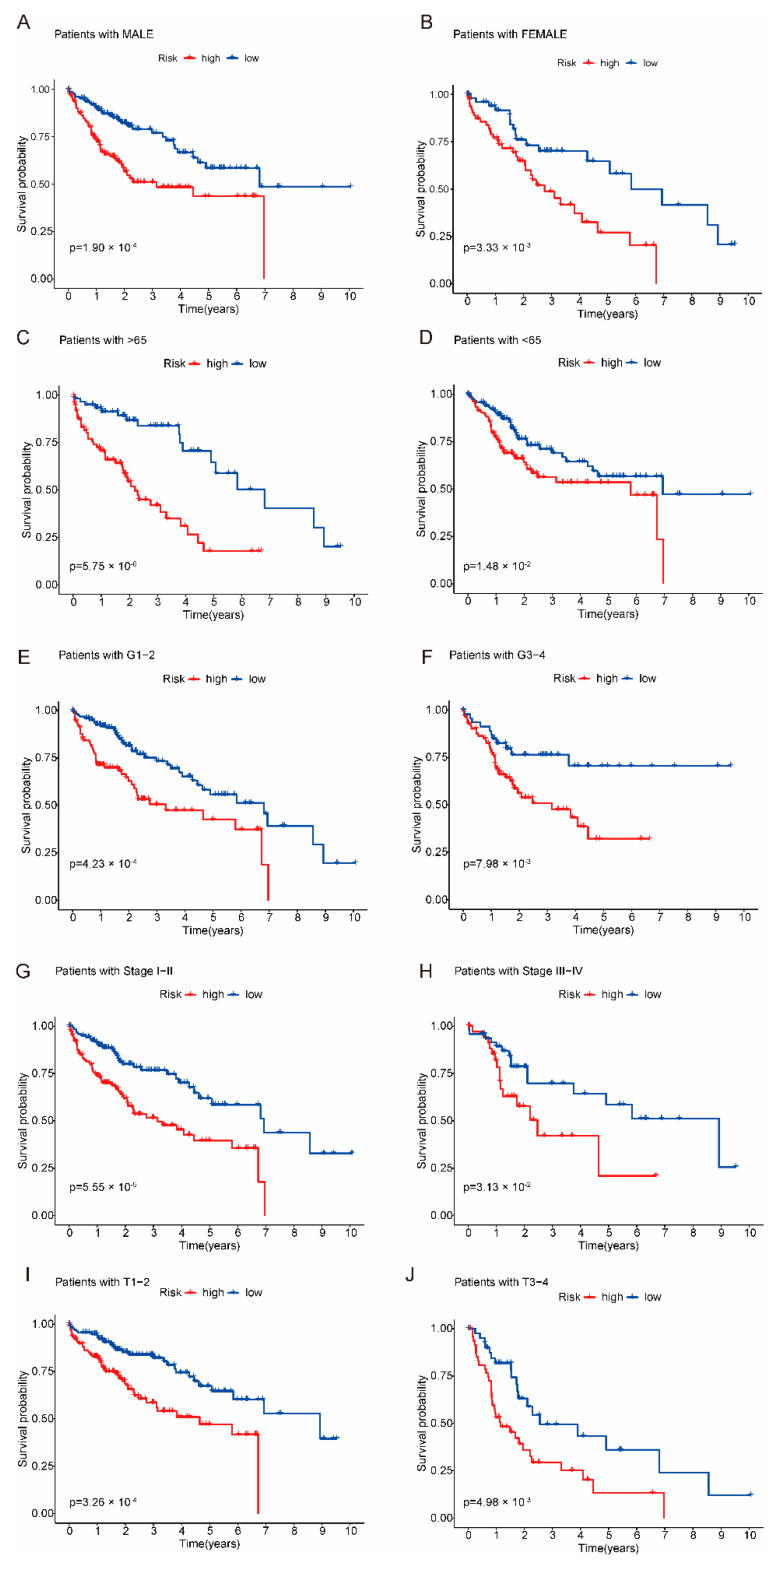
Figure 5.
Kaplan–Meier survival curves of clinical characteristics. The survival rate of the high-risk group was significantly lower than that of the low-risk group. (A) The Kaplan–Meier survival curves plots. The male of patients in the high-risk group had significantly lower survival rates than those in the low-risk group. (B) The Kaplan–Meier survival curves plots. The female of patients in the high-risk group had significantly lower survival rates than those in the low-risk group. (C) Patients with aged > 65 years had significantly lower survival rates than those in the low-risk group. (D) Patients with aged < 65 years had significantly lower survival rates than those in the low-risk group. (E) Patients with grade 1–2 had significantly lower survival rates than those in the low-risk group. (F) Patients with grade 3–4 had significantly lower survival rates than those in the low-risk group. (G) Patients with stage I–II had significantly lower survival rates than those in the low-risk group. (H) Patients with stage III–IV had significantly lower survival rates than those in the low-risk group. (I) Patients with T stage 1–2 had significantly lower survival rates than those in the low-risk group. (J) Patients with T stage 3–4 had significantly lower survival rates than those in the low-risk group.

