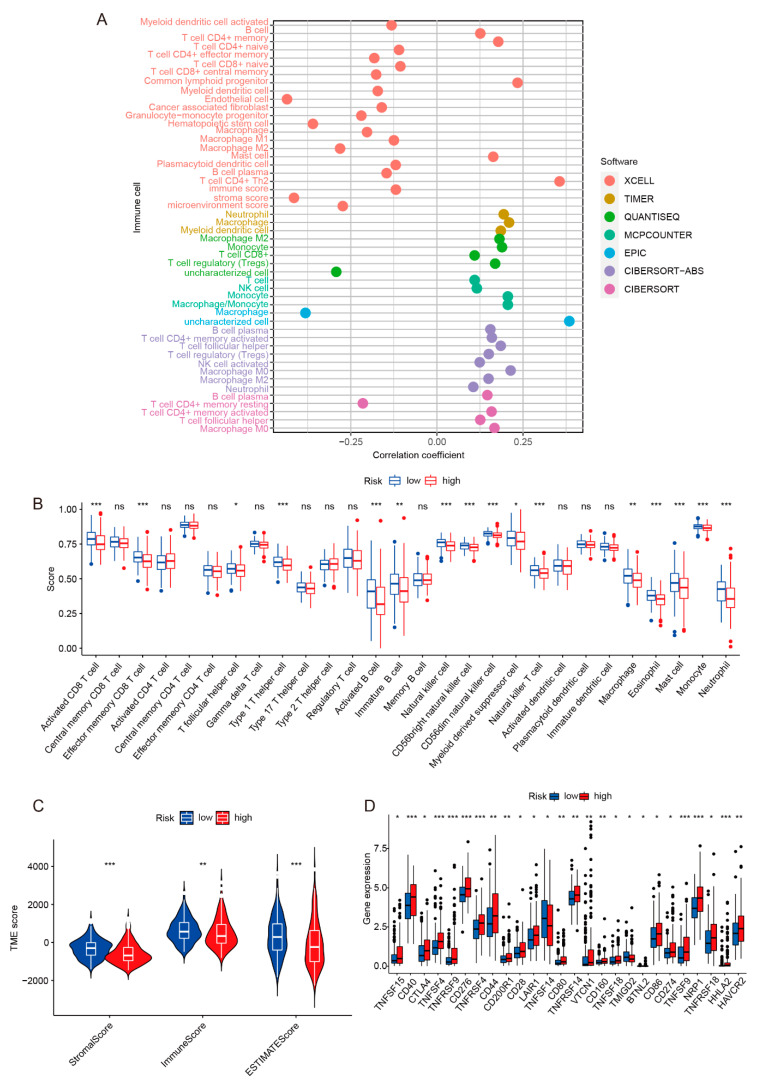
Figure 6.
Assessing the immune infiltration of the risk model. (A) The immune infiltration correlation result was based on TIMER, CIBERSORT, quantTIseq, xCell, MCP-counter, and EPIC algorithms. (B) ssGSEA algorithm was applied to analyze tumor infiltrating lymphocytes (TILs). (C) The tumor microenvironment (TME) was evaluated by using the ESTIMATE algorithm. The high-risk group had significantly lower immune scores than the low-risk group. (D) The difference analysis of immune checkpoint genes between high-risk and low-risk groups. * pvalue < 0.05, ** pvalue < 0.01, *** pvalue < 0.001.

