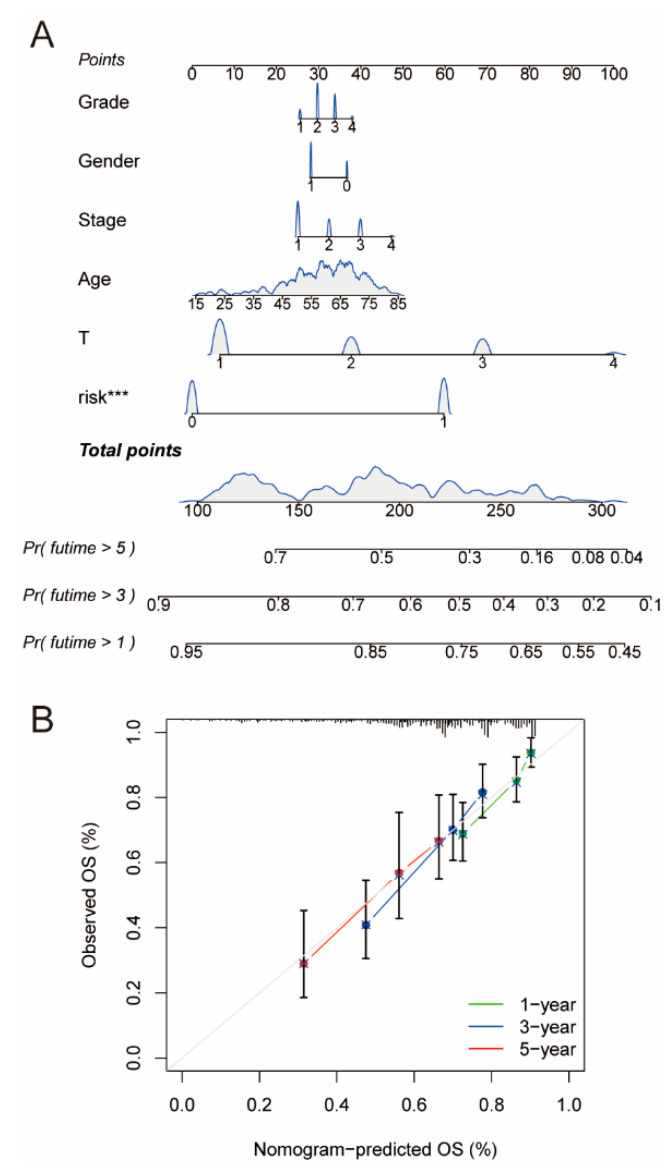
Figure 8.
Construction and evaluation of prognostic nomogram. (A) The prognostic nomogram combined with the risk model and clinical characteristics. A nomograph is a diagram that is based on multivariate regression analysis, integrates more than one prediction indicator, and then makes use of scaled line segments to draw on the same plane at a sure scale to categorize the interrelationships between more than a few variables in the prediction model. The names of the nomograms normally encompass three categories: the top points (scores), the variable names in the middle prediction model (grade, gender, stage, age, T stage, risk), and the prediction probability of survival for 1, 3, and 5 years. (B) The calibration plot of the nomogram. *** pvalue < 0.001.

