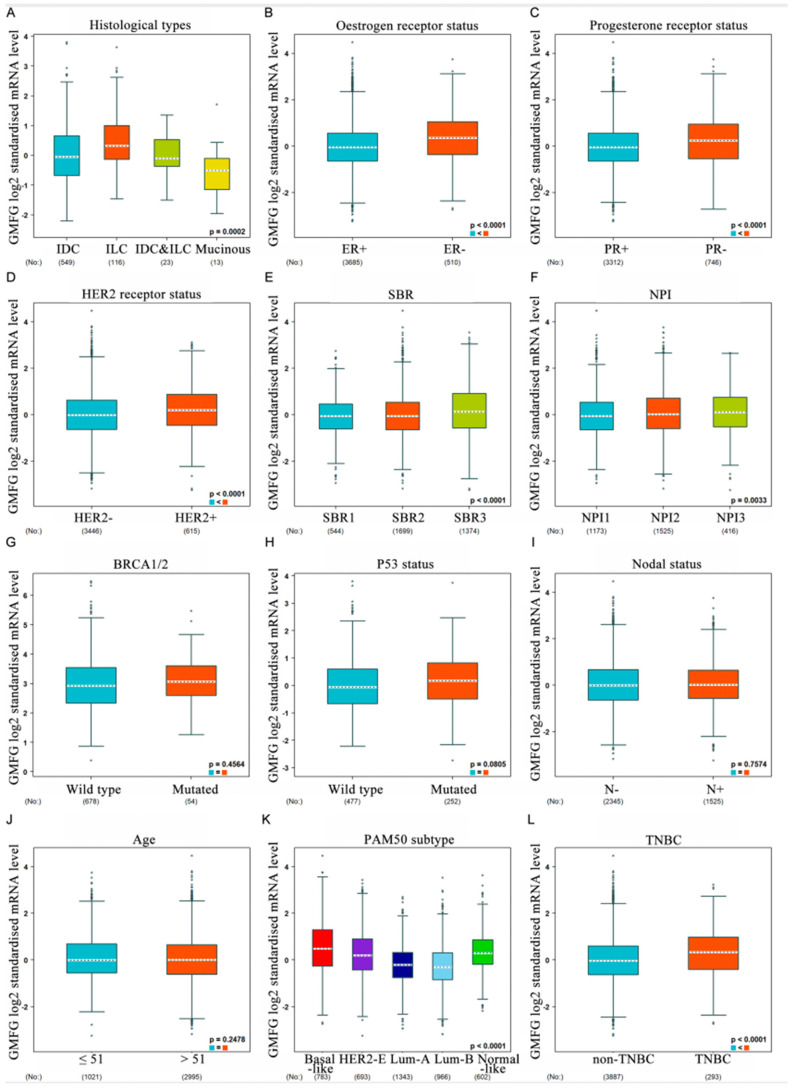
Figure 3.
The violin plot illustrates the relationship of GMFG expression with clinical indicators using bc-GenExMiner. Data include histological types (A), ER (B), PR (C), HER-2 (D), SBR (E), NPI (F), BRCA1/2 status (G), TP53 (H), nodal status (I), age (J),TNBC status (K), and basal-like status (L), (* p < 0.05).

