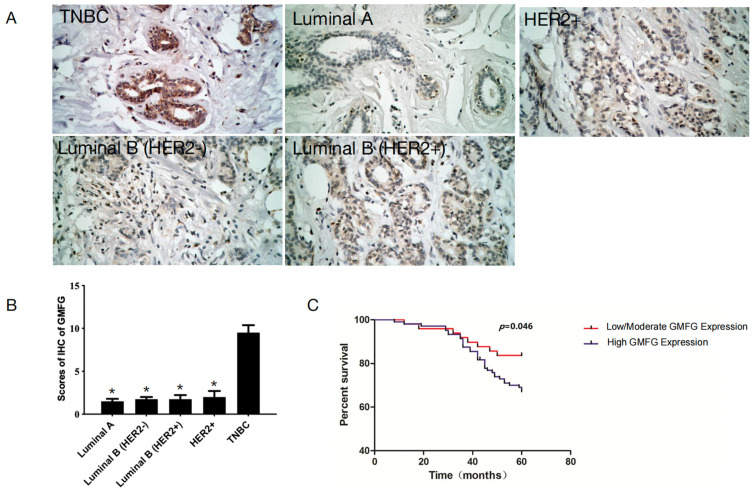
Figure 5.
Evaluation of GMFG expression in different subtypes of breast cancer. (A) Staining of GMFG in Luminal A, Luminal B (Her 2−), Luminal B (Her 2+), and Her-2+ breast cancer types, respectively, by immunohistochemistry. (B) The bar graphs show the IHS of GMFG expression in different subtypes of breast cancer. Values are presented as the mean ± SD (compared with TNBC group, * p < 0.05). (C) Kaplan–Meier curves for overall survival of TNBC patients classified by their GMFG staining intensity.

