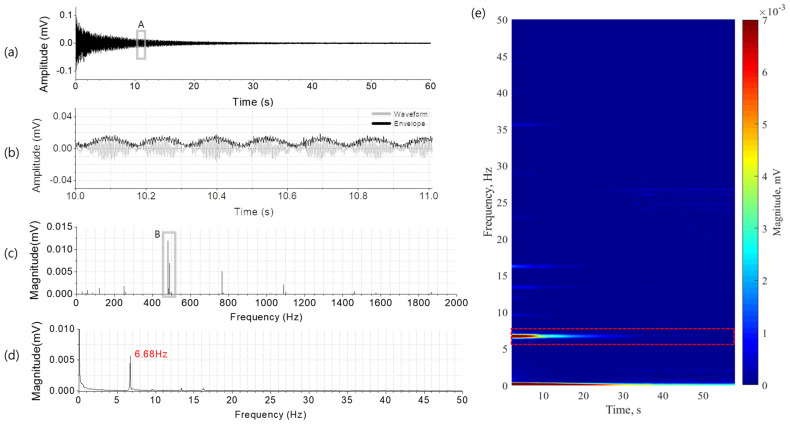
Figure 3.
A typical singing bowl sound plotted in the time and frequency domain: (a) the waveform, (b) a part of the waveform in box A magnified to clearly display the envelope, (c) the frequency spectrum of the entire singing bowl sound waveform, (d) the frequency spectrum of the envelope and (e) the time–frequency representation of the envelope calculated with a window length of 4 s at a time interval of 0.5 s.

