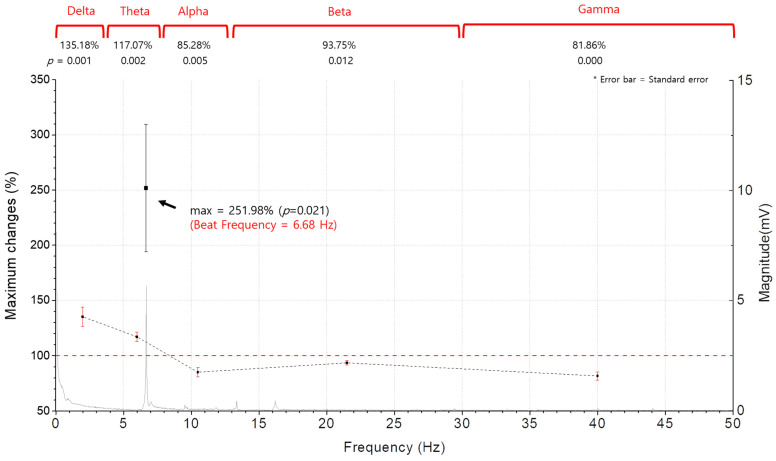
Figure 5.
Comparison of the maximum rate of the relative change in spectral magnitude of each spectral band (A(fb,t) in %), together with the frequency spectrum of the beat of the singing bowl sound. The rate of increase is predominant at the beat frequency, which reaches 251.98% (p = 0.021) of its initial value at the time (t = 275 s) approaching the end of the experiment. This implies that the brain waves are most effectively synchronized at the beat frequency and activated by the singing bowl sound. Among the five clinical EEG frequency bands, the delta wave increased the most to 135.18% (p = 0.001) of its initial state, followed by the theta wave, with a rise of 117.07% (p = 0.002). In contrast, the other three spectral bands decreased after the experiment. The gamma wave was down to 81.86% (p = 0.000), the alpha wave was down to 85.28% (p = 0.005) and the beta wave was down to 93.75% (p = 0.012) of its initial state.

