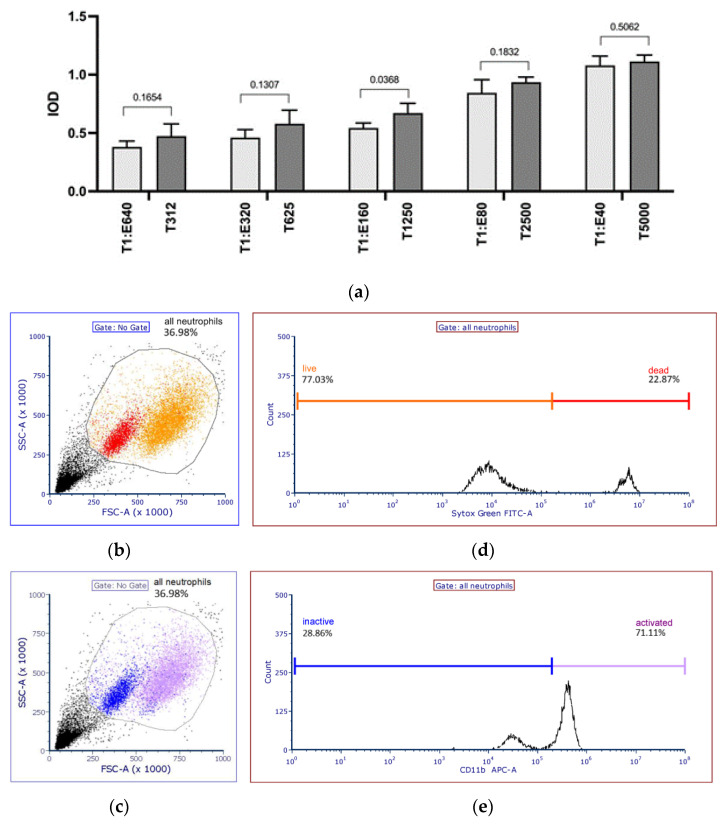
Figure 1.
(a) Dilution of co-cultures and controls measured using XTT and a plate reader. (a) Co-culture of NGs from one healthy participant at different E/T ratios after 16 h of co-incubation with corresponding controls with A. fumigatus only in different concentrations. (b–e) Gating strategy for neutrophil viability and activity. Prior to FACS analysis, purification of the neutrophils was controlled with an XP-300™ cell counter (Sysmex Cooperation, Kōbe, Japan). To identify the dead cell population, a mix of living and dead cells is shown here. For the dead cell controls, cells were killed at 60 °C for 10 min. (b,c) Scatter plot profiles show back gating to confirm gating strategy. (d,e) Histograms to evaluate the intensity of the Sytox Green staining or the relative expression of CD11b activation. Only neutrophils gated in scatter plots were used for the histograms. Cells were backgated onto FSC vs. SSC to identify specific neutrophil populations. FITC: fluorescein isothiocyanate; NG: neutrophil granulocyte.

