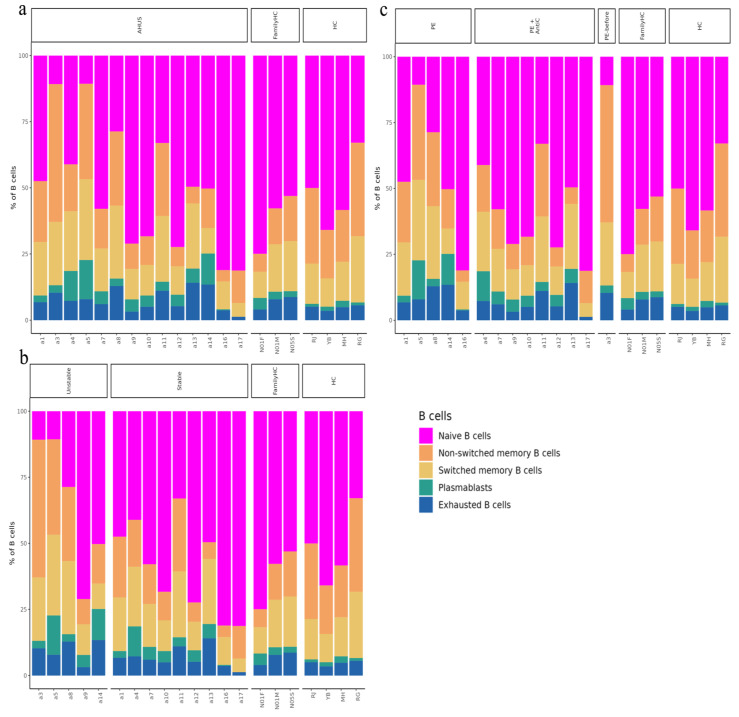
Figure 2.
The relative abundance of subpopulations of B-cells is shown in (a), while the impact of aHUS disease activity on B-cell subpopulations is presented in (b), and the influence of aHUS treatment on B-cell subpopulations is shown in (c). The identifiers N01F, N01M, and N05S correspond to the individual cases of three aHUS family members included in our study. Similarly, the identifiers RJ, YB, MH, and RG denote the individual cases of four healthy controls in our study.

