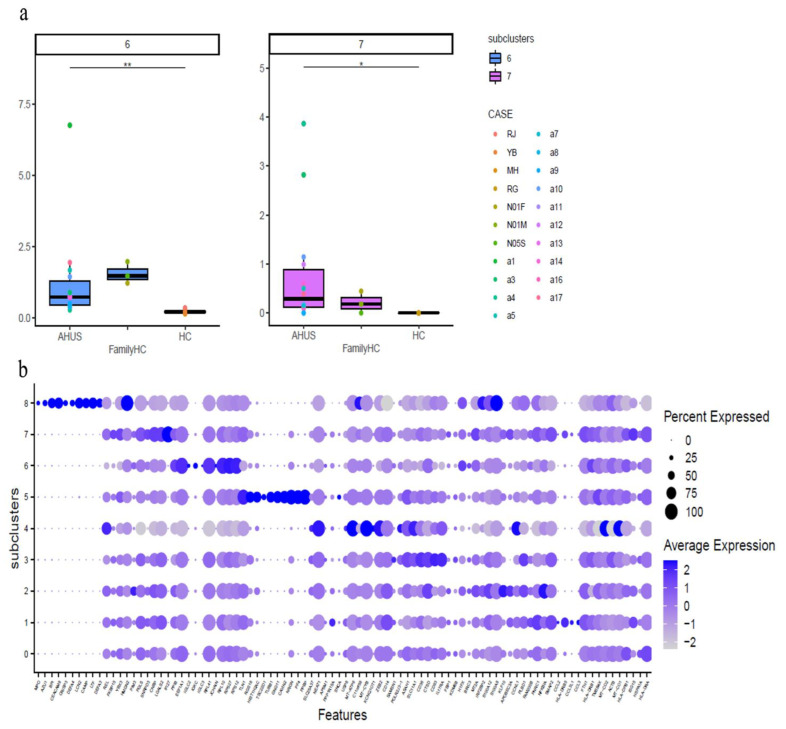
Figure 8.
The figure presents boxplots displaying the subcluster significant abundance of classical monocytes (a) in PBMCs of individuals with aHUS, aHUS family, and healthy subjects. (b) Dot plots of the gene expression profiles of the top 10 marker genes in each subcluster are also provided. Statistically significant differences are indicated by * p < 0.05 and ** p < 0.01.

