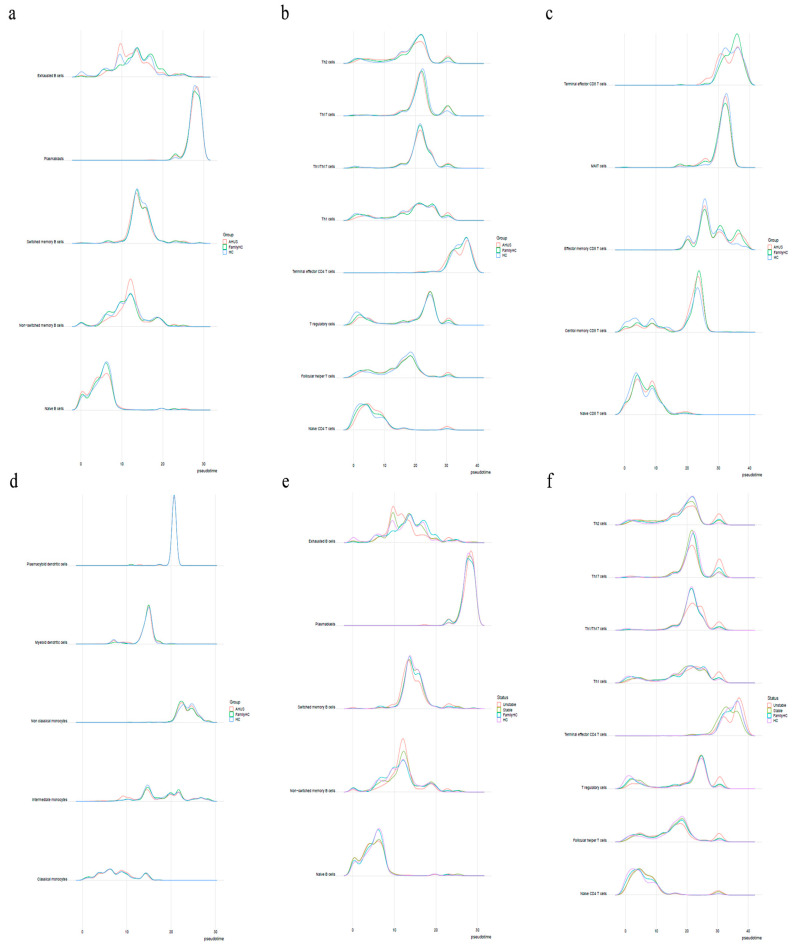
Figure 10.
(a) Shows the pseudotime interval difference and abundance of B-cells, while (b,c) show the pseudotime interval difference and abundance of T-cells. (d) The pseudotime interval difference and abundance of monocytes. The pseudotime interval difference and abundance of B-cells (e) and T-cells (f), respectively, among the unstable aHUS group, stable aHUS group, aHUS family, and healthy subjects.

