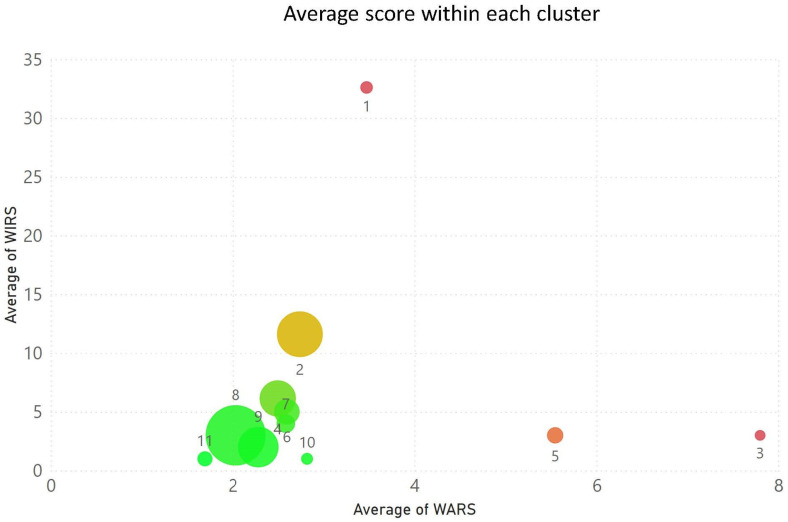
Figure 5.
Population groups at risk from both multiple anticholinergic prescription and polypharmacy. The circle location reflects the average risk scores within each group and the circle size reflects their population. The circles are colour coded from red to amber and green in hierarchical risk order with red the highest and green the lowest risks.

