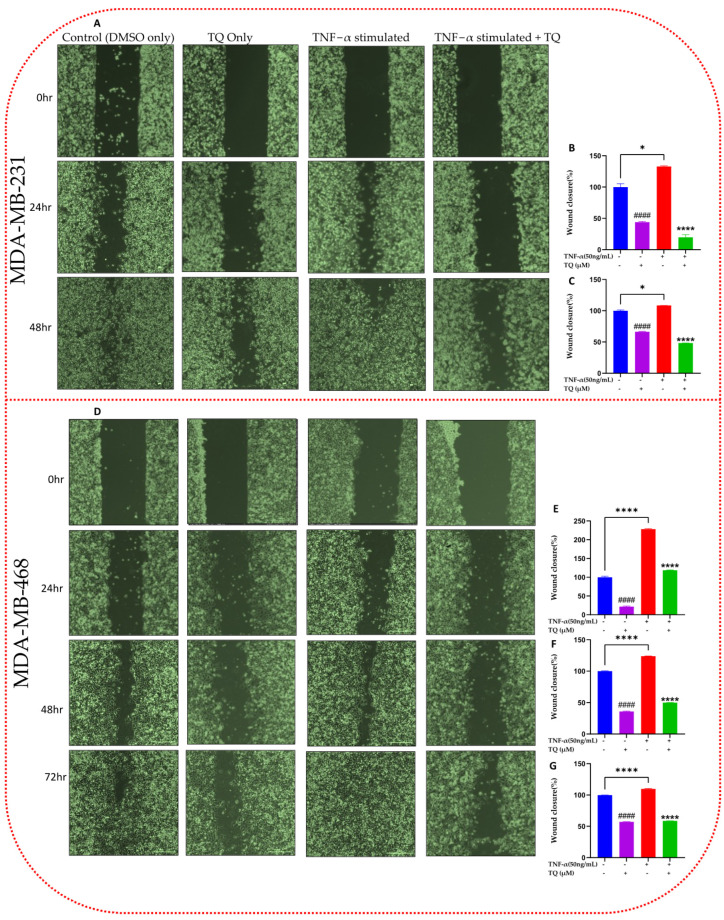
Figure 4.
Effect of TQ on the migration assay in TNF-α-stimulated MDA-MB-231 (A) and MDA-MB-468 (D) cells: TNBC cells of the same cell densities (3.5 × 10⁴ /mL) were seeded in 2-well inserts and incubated overnight. Following removal of the insert and wash with 1× PBS after 24 h, the cells were treated with TNF-α (50 ng/mL) ± TQ (10 µM) and imaged at 0 time (phase contrast, 20×). Both cells were incubated until the TNF-α-only stimulated cell gaps were closed. At 24 and 48 h, cells were again imaged for both cells, and after 72 h for MDA-MB-468 cells; then, the gap width was analyzed. The generated data (B,C,E–G) are presented as the mean ± SEM of three independent experiments in the bar graph. An unpaired t-test was used to analyze the significance of the difference between TNF-α-stimulated vs. < 0.1 DMSO-treated nonstimulated cells (#) and TNF-α-activated vs. TQ cotreated cells (*). * p < 0.05 and ####/**** p < 0.0001. Scale bar: 300 µm.

