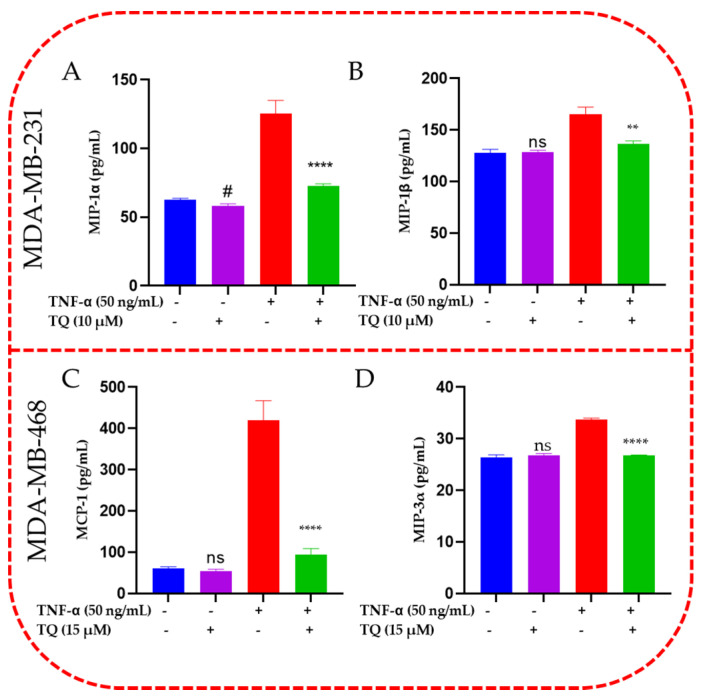
Figure 6.
ELISA quantifications and validation for MIP-1 alpha, MIP-1 beta, MCP-1 and MIP-3 alpha release from TNF-α-stimulated MDA-MB-231 (A,B) and MDA-MB-468 cells (C,D). The normalized data show the protein expression (pg/mL) in four samples of cell supernatants, namely control, TQ-treated, TNF-α-treated cells, and cotreated cells (TNF-α + TQ). The data generated from three independent experiments are presented as the mean ± SEM. The significant difference between TQ-treated cells vs. control cells (#) or between TNF-α-stimulated vs. cotreated cells (#) groups was analyzed using an unpaired t-test. # p < 0.05, ** p < 0.01, and **** p < 0.0001 are considered significant differences, ns not significant.

