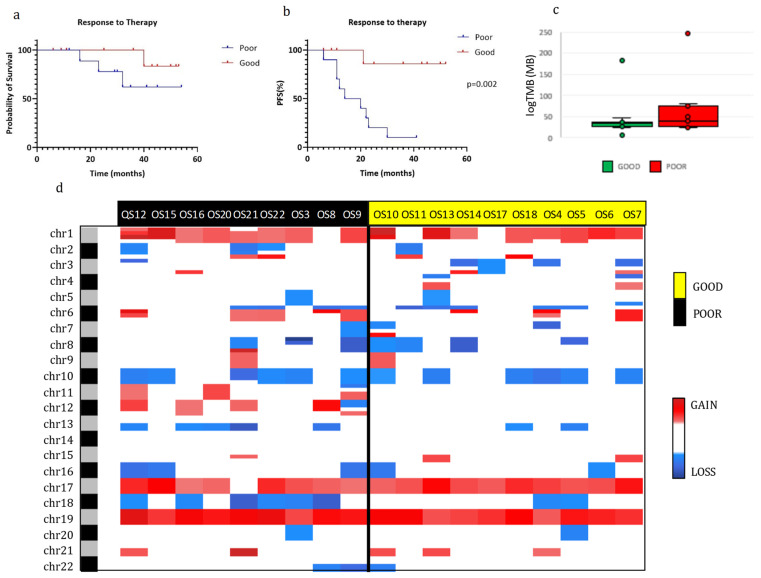
Figure 2.
Molecular characterization of osteosarcomas in good and poor responders. (a,b): Kaplan–Meier overall survival (OS) (a) and progression-free survival (PFS) (b) curves of OS patients according to chemotherapy response. (c) Tumor mutational burden (TMB) of good and poor responders. (d) Heatmap of individual copy number region profiles between poor (n = 9) and good (n = 10) responder groups (red for chromosome gains and blue for losses). Abbreviations: Good, good responders; Poor, poor responders.

