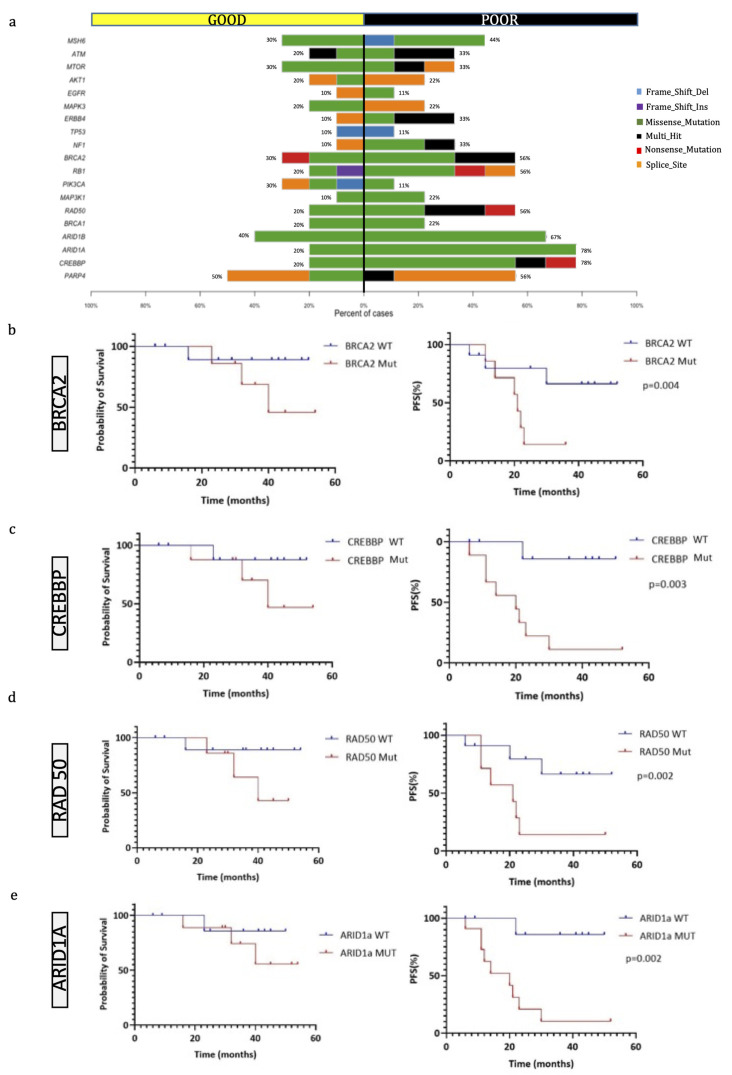
Figure 3.
Genes most frequently mutated in OS patients. (a) Co-bar plot of the genes significantly discriminating good and poor responders. Bars represent the % of samples in which gene mutations have been identified and colors indicate the type of mutation. (b–e) Kaplan–Meier overall survival (OS) curves on the left and progression-free survival (PFS) curves (on the right) of OS patients according to the mutational status of BRCA2 (b), CREBBP (c), RAD50 (d), and ARID1a (e).

