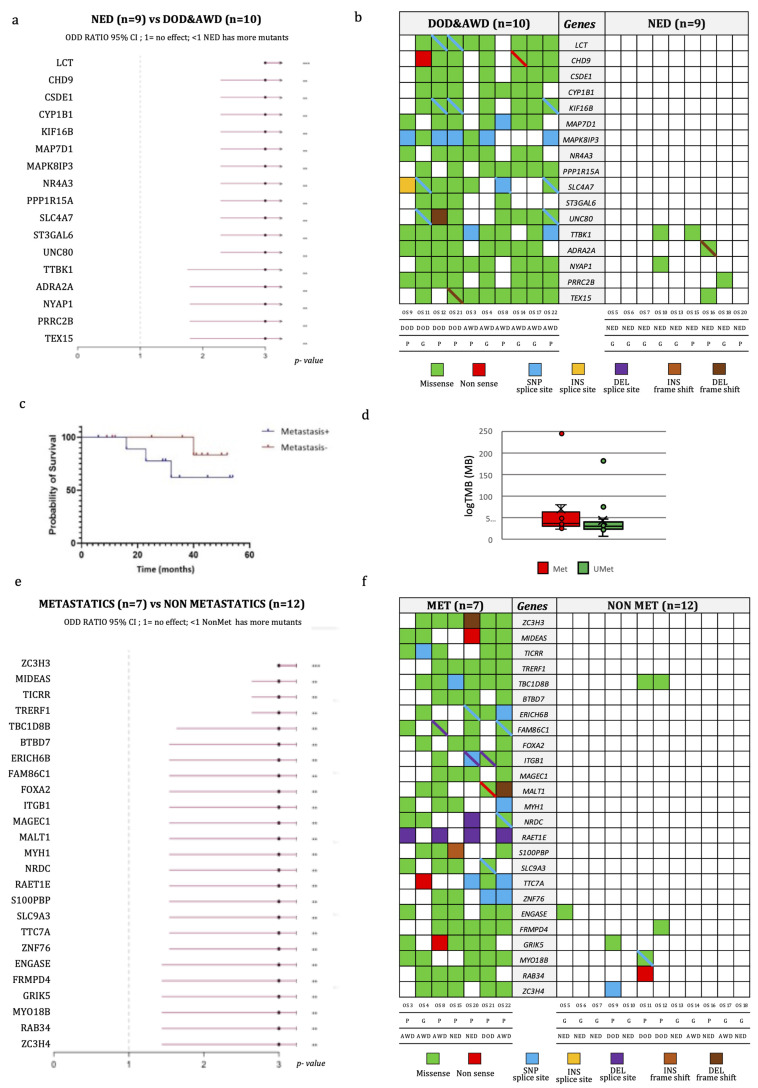
Figure 4.
Genomic characteristics of OS according to disease progression. (a) Odds-ratio plot of differentially mutated genes discriminating patients with disease progression from those with no evidence of disease at last follow-up. (b) Variant types of differentially mutated genes, listed in the central gray column, discriminating patients with no evidence of disease at last follow-up (on the right) from the other patients (on the left). Each cell represents a patient, whose code, response to treatment and disease status is reported at the bottom. The different colors represent the variant types as indicated in the legend. The diagonal bar indicates the co-presence of 2 variants: one from the color of the cell, and the other from the color of the bar. (c) Kaplan–Meier overall survival (OS) curve of OS patients according to the presence of metastasis. (d) Tumor mutational burden (TMB) of metastatic and non-metastatic OS patients. (e) Odd-ratio plot of differentially mutated genes discriminating metastatic from non-metastatic patients. (f) Variant types of differentially mutated genes, listed in the central gray column, discriminating metastatic (on the left) from non-metastatic patients (on the right). Each cell represents a patient, whose code, response to treatment and disease status is reported in the bottom. The different colors represent the variant types. The diagonal bar indicates the co-presence of 2 variants, one indicated by the color of the cell and the other by the color of the bar. ** p-value ≤ 0.01: *** p-value ≤ 0.001. Abbreviations: P, poor responders; G, good responders; AWD, alive with disease; NED, non-evidence of disease; DOD, dead of disease; INS, insertion; DEL, deletion.

