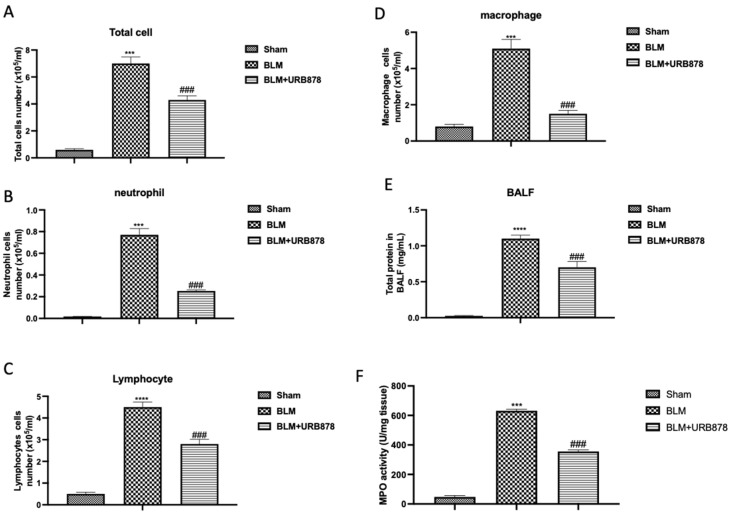
Figure 2.
URB878 decreased bleomycin-induced inflammatory cell migration. Total (A) and differential cell counts (B) for neutrophils; (C) for lymphocytes; (D) for macrophages in bronchoalveolar lavage fluid (BALF); total protein concentration in BALF (E), and MPO activity (F). Data are expressed as the mean ± SEM of n = 6 animals for each group. *** p < 0.001 vs. sham; **** p < 0.0001 vs sham; ### p < 0.001 vs. bleomycin.

