Figure 3.
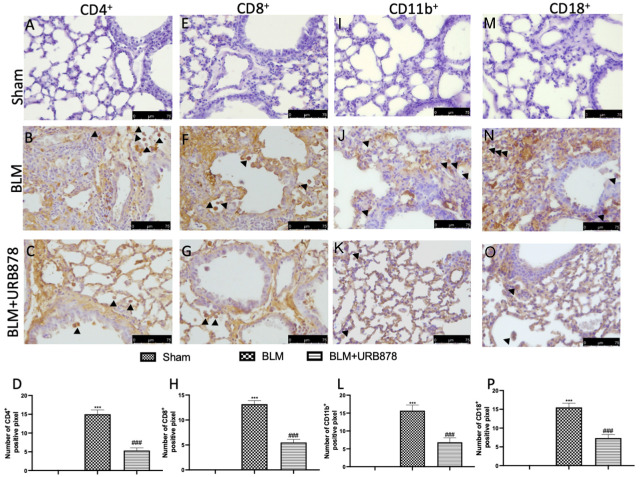
URB878 administration reduced cell infiltration. Sham (A); BLM (B); BLM+URB878 5 mg/kg (C); graphical analysis (D) for CD4. Sham (E); BLM (F); BLM+URB878 5 mg/kg (G); graphical analysis (H) for CD8. Sham (I); BLM (J); BLM+URB878 5 mg/kg (K); graphical analysis (L) for CD11b. Sham (M); BLM (N); BLM+URB878 5 mg/kg (O); graphical analysis (P) for CD18. Values are the means ± SEM of 6 mice for all groups. Photos shown are representative of the results obtained. See manuscript for further details. *** p < 0.001 vs. sham; ### p < 0.001 vs. bleomycin. Arrows indicate positive cells.

