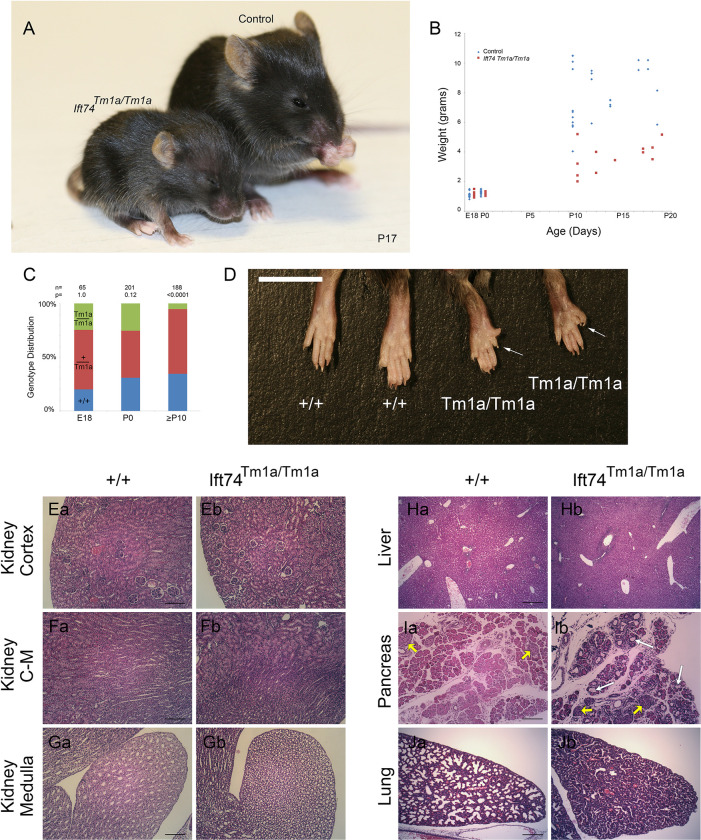
Fig 5. Ift74Tm1a (Exon 2 Skip) Mutation Causes Post Natal Lethality.
(A) Images of control and mutant mice at postnatal day 17. Note the smaller size and hydrocephaly in the mutant. (B) Weight of mice with respect to age. Each point represents a mouse at a particular age. Differences are significant with respect to genotype (P<0.0001, F test). (C) Genotype distribution at the day prior to birth (E18), the day of birth (P0) and at genotyping age (P10 to P21). Number of animals is listed along with the P value determined by Chi Square analysis is listed at the top. (D) Images of hindlimbs of controls and mutant animals. Note the extra digits on the mutants. (E-G) H&E Images of P15 kidney cortex (control Ea, mutant Eb), cortical-medullary boundary (control Fa, mutant Fb) and medulla at the tip of the papilla (control Ga, mutant Gb). Scale bars are 100 microns. (H) H&E Images of P8 liver (control Ha, mutant Hb). Scale bar is 200 microns. (I) H&E Images of P8 pancreas (control Ia, mutant Ib). Islets are marked with yellow arrows. White arrows mark examples of cysts. Scale bar is 100 microns. (J) H&E Images of P0 lung (control Ja, mutant Jb). Scale bar is 200 microns.

