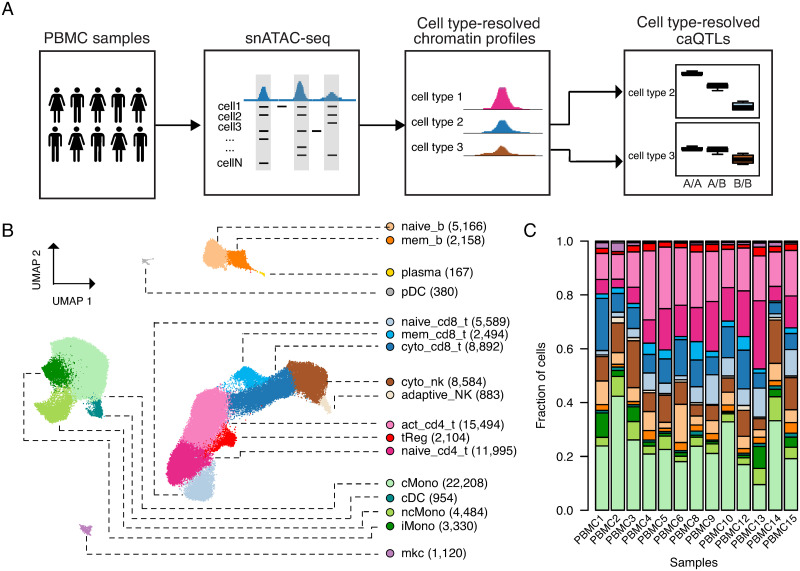
Fig 1. Single nucleus ATAC-seq in a population of PBMC samples.
A) Schematic overview of the study. B) Clustering of single cell accessible chromatin profiles of 96,002 PBMCs from 13 individuals. Cells are plotted based on the first two UMAP components. Seventeen distinct clusters, indicated by different colors, were identified and assigned to a cell type based on known marker genes. The number of cells for each cell type is indicated in parenthesis. C) Barplot showing the relative proportions of each cell type in each sample. Color scheme is the same as in 1B.

