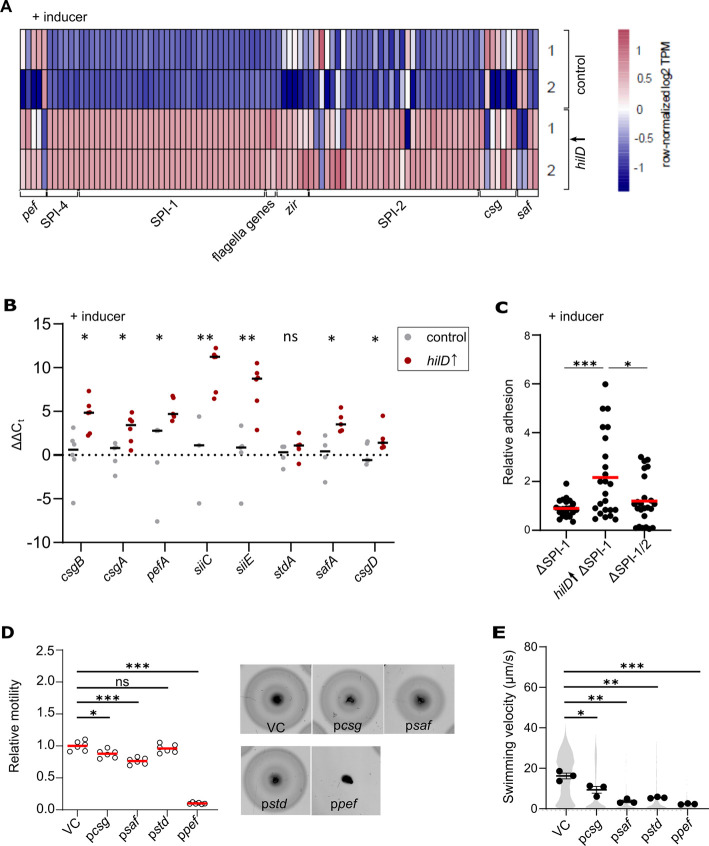
Fig 2. HilD activates expression of adhesive structures in Salmonella Typhimurium.
(A) Heatmap of selected differentially expressed genes of the control (EM808) and hilD↑ (TH16339) strains. The TPM values of these selected genes were row normalised across the samples from two biological replicates (1, 2). (B) Validation of differential expression of siiC, siiE, csgA, csgB, csgD, pefA, safA, stdA, and fimZ in a HilD-induced strain compared to the control using qRT-PCR. Data from three or more biological replicates are shown as individual data points for each condition. Horizontal bars represents the calculated mean of biological replicates. Statistical significances were determined using a two-tailed Student’s t-test (**, P < 0.01; *, P < 0.05;; ns, P > 0.05). Strains analysed were the same as in (A). (C) Relative adhesion of different Salmonella strains to MODE-K murine epithelial cells. MODE-K cells were incubated with different ΔSPI-1 strains at a MOI of 10 for 1 h at 37°C. After extensive washing, cells were lysed and plated for CFU assessment. Counted CFU values were normalized to the ΔSPI-1 strain as a control. Data from 24 biological replicates are shown as individual data points. Horizontal bars (red) represent the calculated mean of biological replicates. Statistical significances were determined using a two-tailed Student’s t-test (***, P < 0.001; *, P < 0.05). Strains analysed were EM830 (ΔSPI-1), EM93 (hilD↑ ΔSPI-1) and EM829 (ΔSPI-1/2). hilD↑: strain expressing hilD under an inducible promoter. (D) Swimming motility of strains overexpressing different adhesins in trans in soft-agar swim plates was monitored at 37°C for 3.5 h. Diameters of swimming halos were measured and normalized to the control strain (left). Representative swimming halos of the analysed mutants are shown (right). Data from six biological replicates are shown as individual data points. Horizontal bars (red) represent the calculated mean of biological replicates. Strains analysed were EM12144 (VC, vector control), EM12145 (pcsg), EM12146 (psaf), EM12147 (pstd), EM12148 (ppef). Statistical significances were determined using a two-tailed Student’s t-test (***, P < 0.001; *, P < 0.05; ns, P > 0.05). (E) Single-cell swimming velocities of strains overexpressing different adhesins. Individual data points represent the averages of the single-cell velocities of independent experiments. Violin plots represent data values from at least 700 analysed single-cell tracks. Horizontal bars (bold) represent the mean of the calculated average velocities of three independent experiments. The error bars represent the standard error of mean and statistical significances were determined using a two-tailed Student’s t-test (***, P < 0.001; **, P < 0.01; *, P < 0.05). Strains analysed were the same as in panel (D). AnTc: anhydrotetracycline.

